Machine Traces of Discovery Paths #1 — Lab Notebook

The evidence behind the Deep Dive essay “Machine Traces of Discovery Paths #1 — The Path to iPS Discovery.” Four technical documents: the trace reconstruction, the methods-and-findings report, and — for the NAT1 (2000) hinge experiment — the structured protocol extraction and the tagged bench reconstruction. Each document is self-contained and reproducible from the primary data.
Contents
- Evidence 1 — Trace report
- Evidence 2 — Analysis findings
- Evidence 3 — Protocol extraction (NAT1, 2000)
- Evidence 4 — Bench protocol (NAT1, 2000)
Machine Traces of Discovery Paths #1 — Evidence 1 of 4 · Trace report
Verifiable source document for the Deep Dive essay Machine Traces of Discovery Paths #1 — The Path to iPS Discovery. It also underpins the companion essays Connecting Distant Dots (Post #3) and Can a Machine Connect Distant Dots? (Post #4). This is a technical evidence document, not a process journal; every figure is reproducible from the primary data.
Reconstructed from the primary literature: 275 disambiguated PubMed records (1990–2026), 1,982 parsed reference entries from his pre-2008 papers, and Europe PMC citation counts.
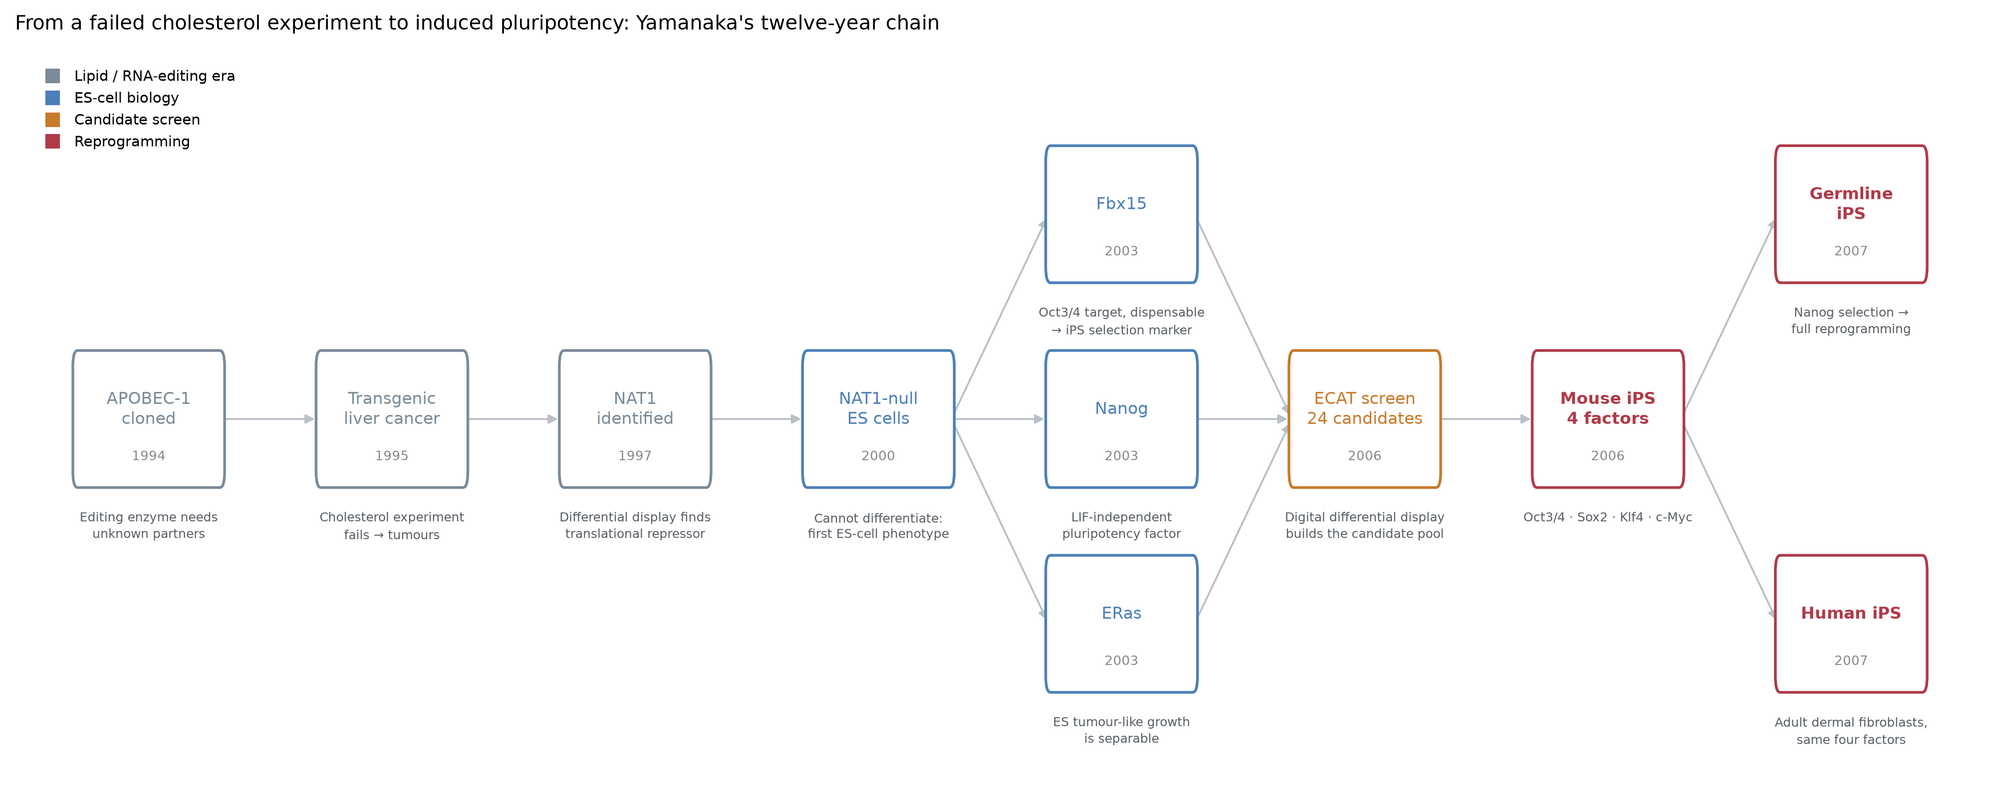
Discovery chain
The short version
The iPS discovery was not a stem-cell project that happened to succeed. It was the terminus of a chain that began with a failed cholesterol-lowering experiment and was carried forward by one unusually consistent research instinct: when an unexpected result appears, chase the unexpected result rather than the original hypothesis.
Four hinge points, each documented in the record:
- 1995 — An APOBEC-1 transgenic experiment intended to lower LDL cholesterol instead gave every animal liver dysplasia and many hepatocellular carcinoma. He pivoted from lipids to why.
- 1997 — Chasing that "why" via differential display, he found NAT1, a gene of his own discovery. This gave him a gene to take independent.
- 2000 — NAT1-knockout ES cells were normal in every respect except that they could not differentiate. This is the moment he became a stem-cell biologist — and it arrived through a knockout mouse of a lipid-adjacent gene.
- 2003–2006 — Systematic identification of ES-cell-specific genes (the ECAT set), then the reverse question: not "what maintains pluripotency" but "what can install it."
Phase 1 — Osaka City University, 1990–1993: clinical pharmacology
The earliest indexed work is not molecular biology at all. Nine papers on canine renal and vascular pharmacology — endothelin, nitric oxide synthase inhibition, platelet-activating factor, thromboxane — from the Department of Pharmacology, Osaka City University Medical School.
| Year | Paper | Role |
|---|---|---|
| 1990 | Endothelin and renal hemodynamics in anesthetized dogs (Am J Hypertens) (Miura, K. et al., 1990) | middle author |
| 1992 | Hypotensive action of platelet-activating factor (Circ Res) (Yamanaka, S. et al., 1992) | first author |
| 1993 | 11-Dehydro thromboxane B2 as a marker of thromboxane A2 production (Prostaglandins) (Yamanaka, S. et al., 1993) | first author |
This is PhD-era physiology. Median citations: ~20. Nothing here anticipates pluripotency — but it establishes the whole-animal, phenotype-first orientation that later makes him reach for knockout mice rather than cell-culture assays.
Phase 2 — Gladstone Institute / UCSF, 1994–1997: the productive failure
He joins Thomas Innerarity's lab working on apolipoprotein B mRNA editing — a cytidine-to-uridine deamination at a single base (C6666) that truncates apoB100 into apoB48.
1994, J Biol Chem (first author) — clones the rabbit apoB mRNA editing protein (REPR/APOBEC-1) (Yamanaka, S. et al., 1994), shows a zinc motif is essential for catalysis, and finds that the required auxiliary factors are present in tissues that never edit apoB. The specificity is not in the enzyme. That observation is the seed of everything that follows.
1995, PNAS (first author) — the pivot (Yamanaka, S. et al., 1995). Transgenic rabbits and mice overexpressing APOBEC-1 in liver were built to test whether hepatic editing would lower LDL. It did. But the abstract records the word that changed his career: "Unexpectedly, all of the transgenic mice and a transgenic rabbit had liver dysplasia, and many transgenic mice developed hepatocellular carcinomas."
He did not treat this as a failed lipid experiment. He treated it as a cancer question.
1996, J Biol Chem (Yamanaka, S. et al., 1996) — resolves the mechanism: overexpressed APOBEC-1 hyperedits cytidines beyond C6666 and does so without requiring the mooring sequence. Off-target RNA editing is the tumour mechanism. This implies other, non-apoB transcripts are being edited — so which ones?
1997, Genes Dev (Yamanaka, S. et al., 1997) — using modified differential display on the tumour-bearing livers, he identifies NAT1 (Novel APOBEC-1 Target 1): an eIF4G-homologous protein that binds eIF4A but not eIF4E, and represses both cap-dependent and cap-independent translation. A general translational repressor, hyperedited into inactivation in the tumours.
He now owns a gene. That is the currency required to start an independent lab.
Phase 3 — Return to Osaka, 1997–1999: the difficult interval
The record shows the cost of repatriation. Between 1997 and 1999 his name appears mostly as a middle author on the Iwao lab's cardiovascular MAP-kinase and angiotensin work — competent papers in Hypertension, Circulation, J Am Soc Nephrol, but not his own program. Two exceptions are his: the Genomics paper on the human OLR1 gene (1998, first author) and a Japanese-language review of RNA editing (1997). This is the period he has publicly described as his lowest, and the authorship pattern corroborates it independently.
Phase 4 — NAIST, 2000–2003: the accidental entry into stem cells
2000, EMBO J (first author, with Innerarity still on the paper) — the NAT1 knockout (Yamanaka, S. et al., 2000). The result is the hinge of the entire story:
- NAT1-null embryos die during gastrulation.
- NAT1-null ES cells are normal in morphology, proliferation, global translation, and expression profile.
- But they are resistant to retinoic-acid-induced differentiation, and their teratomas contain only undifferentiated and poorly differentiated tissue.
He had gone looking for a translational repressor's function and found a gene that gates the exit from pluripotency. To make this knockout he had to learn ES-cell culture — and the ES cells turned out to be more interesting than the gene.
2003 — three papers in one year define the platform:
- Mol Cell Biol — the Fbx15 paper (Tokuzawa, Y. et al., 2003): Fbx15, an Oct3/4 target expressed specifically in undifferentiated ES cells, regulated by an 18-bp octamer+Sox enhancer. Critically, Fbx15 is dispensable: knockouts are normal. A marker of pluripotency with no function of its own — which makes it a perfect, low-stringency selection reporter. Three years later this is exactly how the iPS screen is read out.
- Nature — the ERas paper (Takahashi, K. et al., 2003): ERas, an ES-specific constitutively active Ras that signals through PI3K, explaining why karyotypically normal ES cells form teratomas. Tumorigenicity and pluripotency are genetically separable.
- Cell — the Nanog paper (Mitsui, K. et al., 2003): Nanog, found by in silico differential display, maintains ES self-renewal independently of LIF/Stat3. Co-discovered with Chambers & Smith (Chambers, I. et al., 2003), whose functional expression cloning paper appears 9 times in his own reference lists.
Note the method common to all three: find genes expressed specifically in ES cells and preimplantation embryos, then test them one at a time. That catalogue became the ECAT series (ES Cell Associated Transcripts) — built by digital differential display (2006, Methods Mol Biol) and pruned by knockouts that kept coming back dispensable (ESG1/ECAT2, 2006, BMC Dev Biol).
Phase 5 — 2006: inverting the question
Every ECAT knockout that turned out dispensable was a small failure by the standard framing ("which gene maintains pluripotency?"). The inversion was to stop asking what maintains the state and ask what can install it — and to accept that the answer might be a combination no single knockout could reveal.
2006, Cell — Takahashi & Yamanaka. (Takahashi, K. & Yamanaka, S., 2006) Two authors. 24 ECAT candidates introduced retrovirally into fibroblasts carrying the Fbx15 selection cassette; pools that worked, then elimination one factor at a time, down to four: Oct3/4, Sox2, c-Myc, Klf4. The abstract notes drily that "Unexpectedly, Nanog was dispensable" — the factor everyone would have bet on, including him.
Every ingredient traces back up the chain:
- Fbx15 selection ← the 2003 Mol Cell Biol paper
- Oct3/4 / Sox2 partnership ← Fbx15 enhancer analysis + the 2005 Sox15/Sox2 study (Maruyama, M. et al., 2005)
- c-Myc ← the ERas/PI3K work on ES proliferative character, and the cancer instinct from 1995
- the 24-gene candidate list ← the ECAT catalogue
- ES-cell culture competence ← the NAT1 knockout
Phase 6 — 2007 onward: closing the gaps
- 2007, Nature (Okita, Ichisaka, Yamanaka) — Fbx15-selected iPS cells were incomplete: wrong methylation, no adult chimaeras. Selecting on Nanog instead gave germline-competent iPS cells (Okita, K. et al., 2007) with silenced transgenes. The rigorous proof.
- 2007, Cell — human iPS cells from adult dermal fibroblasts, same four factors (Takahashi, K. et al., 2007). Published alongside Thomson's independent human result.
- 2008–2011 — systematically removing the objections: without c-Myc (Nat Biotechnol) (Nakagawa, M. et al., 2008), without viral vectors (Science) (Okita, K. et al., 2008), the p53–p21 barrier to efficiency (Nature) (Hong, H. et al., 2009), and integration-free episomal derivation (Nat Methods) — the protocol that made clinical use possible.
- 2017, NEJM — autologous iPSC-derived retinal pigment epithelium transplanted into a patient with macular degeneration.
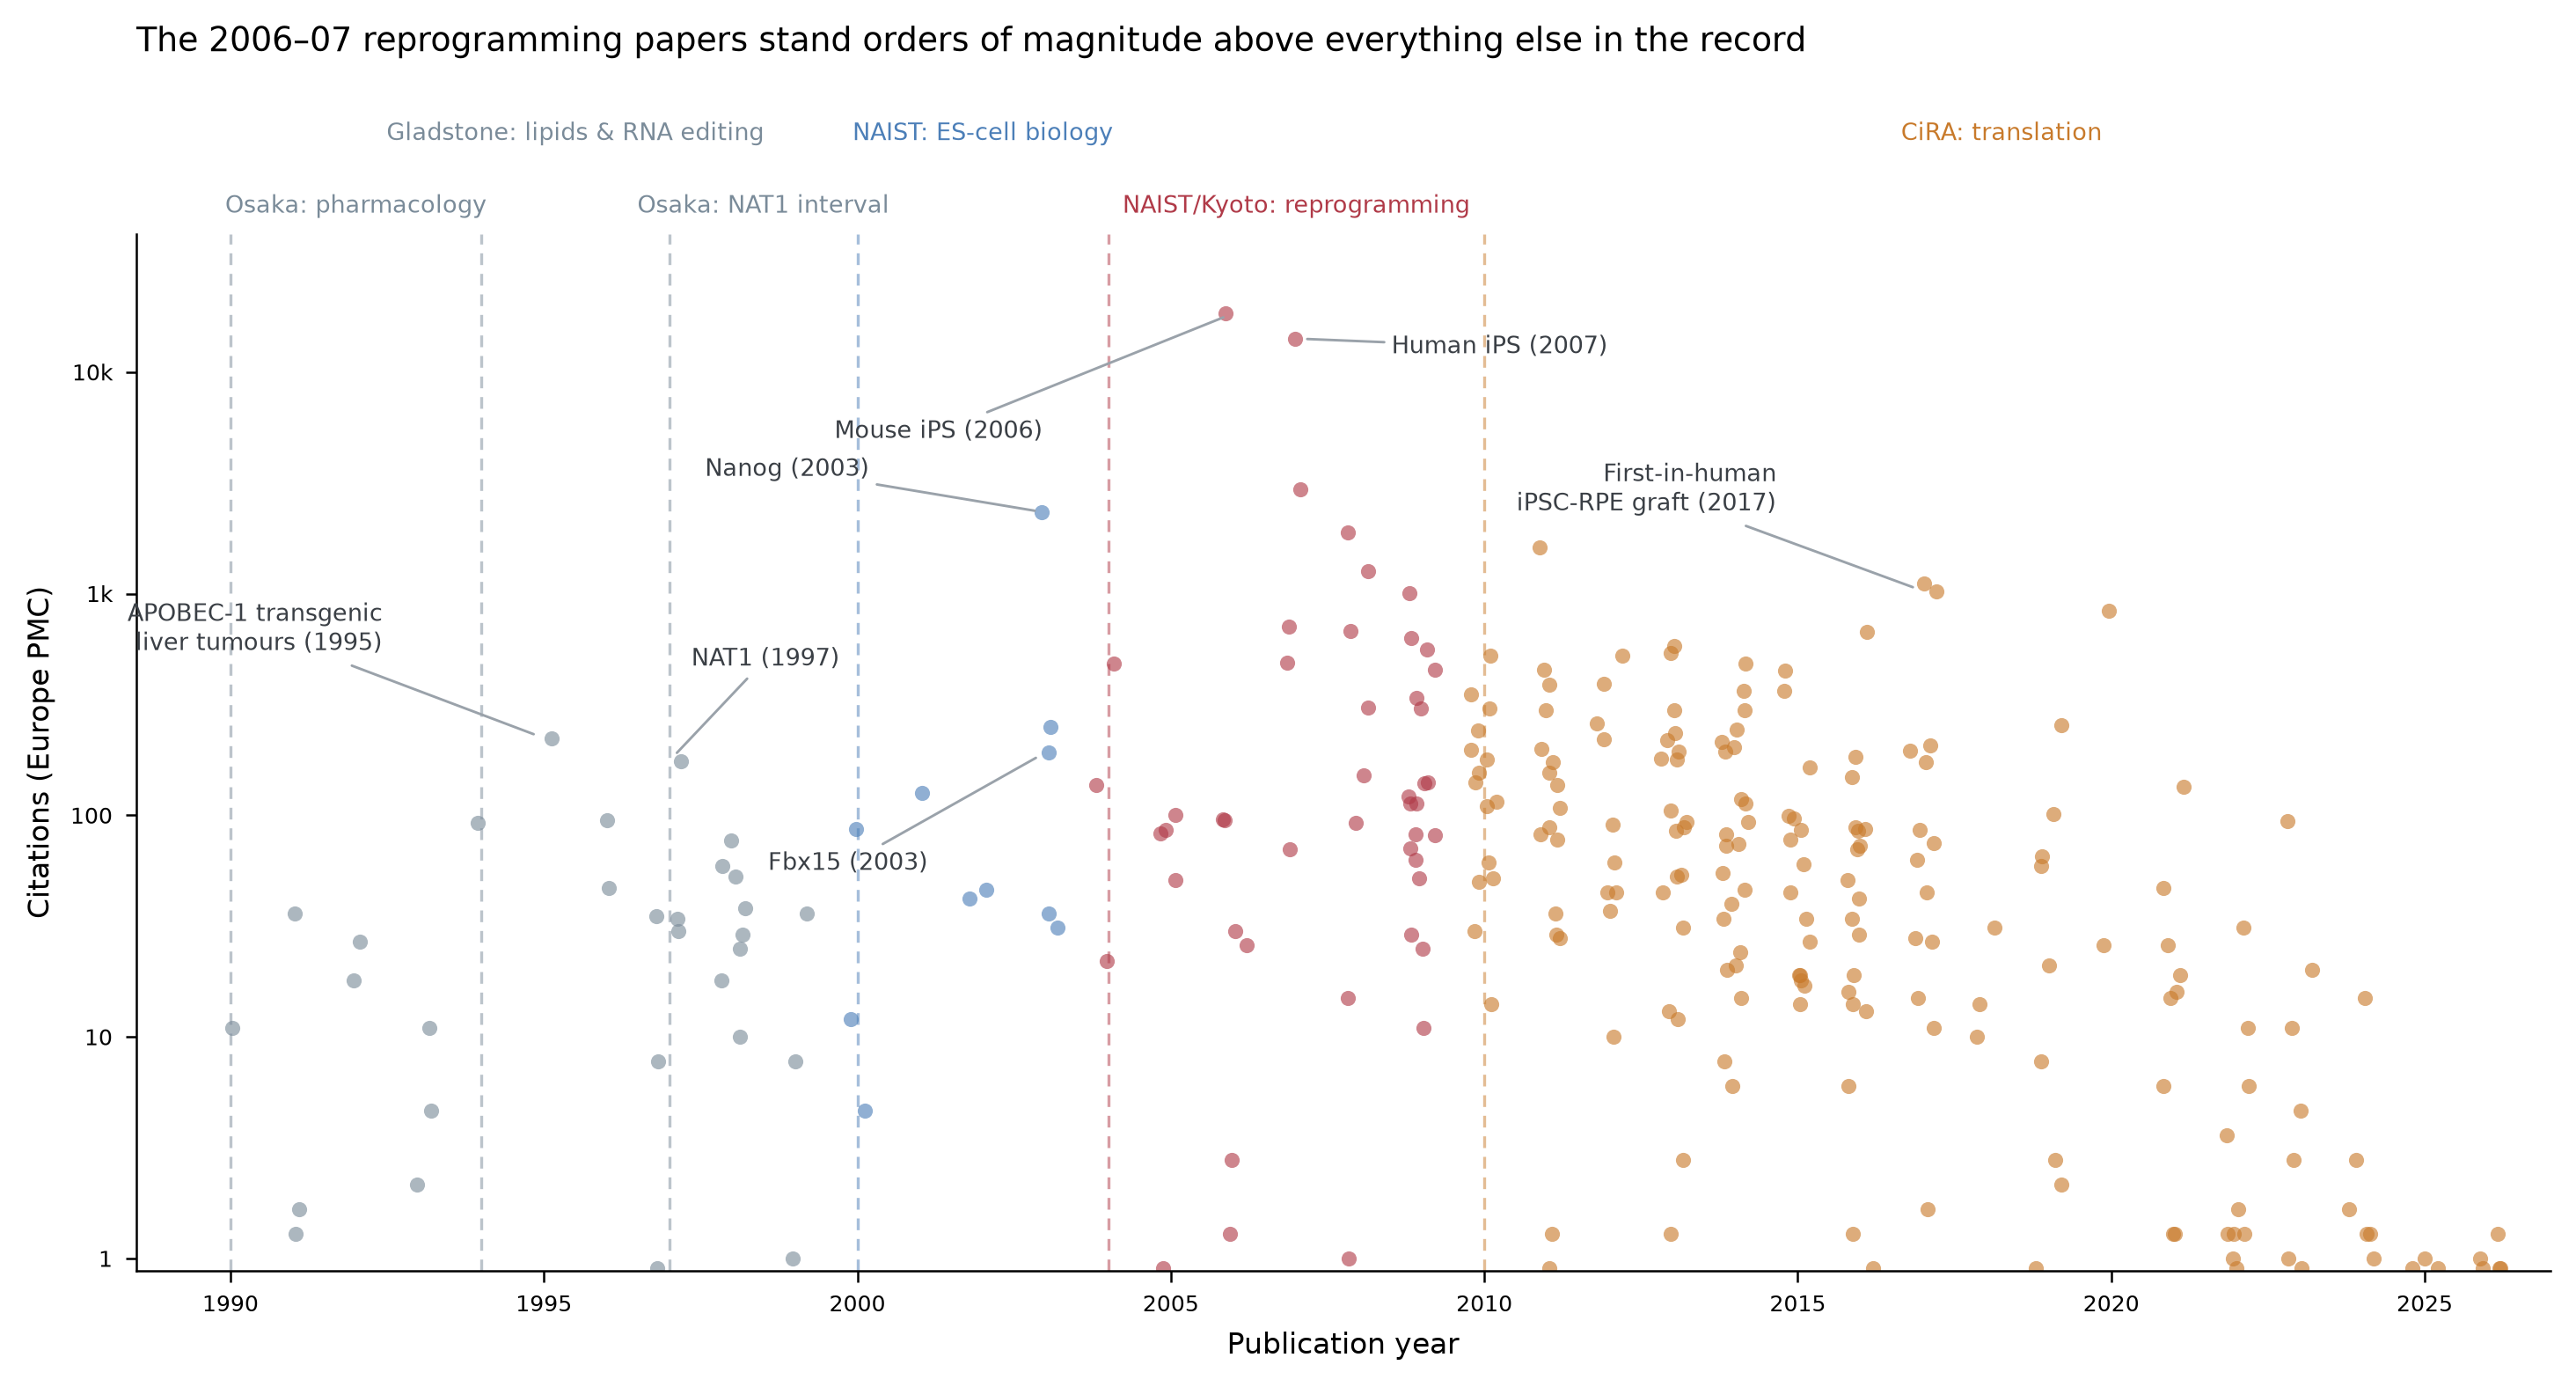
Career citations
What he was standing on
Parsing the reference lists of his pre-2008 papers shows which external work he leaned on most (count = number of his own papers citing it):
| n | Work | Why it mattered |
|---|---|---|
| 12 | Evans & Kaufman 1981; Martin 1981 (Nature/PNAS) | Mouse ES cells exist at all |
| 12 | Thomson et al. 1998 (Science) | Human ES cells — and the ethical problem iPS solves |
| 11 | Nichols et al. 1998 (Cell); Niwa et al. 2000 (Nat Genet) | Oct3/4 as the pluripotency determinant, dose-dependent |
| 9 | Chambers et al. 2003 (Cell) | Nanog by expression cloning |
| 8 | Avilion et al. 2003 (Genes Dev) | Sox2 in early lineages |
| 7 | Morita et al. 2000 (Gene Ther) | Plat-E retroviral packaging — the enabling technology for delivering 24 factors |
| 6 | Yuan et al. 1995 (Genes Dev) | Oct/Sox synergy on the FGF-4 enhancer — the cis-logic behind Fbx15 |
| 5 | Cowan et al. 2005 (Science) | ES fusion reprograms somatic nuclei — proof that trans-acting factors suffice |
The intellectual debt is precise: Gurdon and Wilmut established that the somatic nucleus retains full potential; the fusion experiments established that soluble factors in ES cells can impose that state; Yamanaka's contribution was to reduce those factors to a defined, testable list — and he could only build that list because he had spent three years cataloguing ES-specific transcripts for an entirely different reason.
The reproducible thought pattern
Reading the chain end to end, four habits recur:
- Anomalies are promoted, not explained away. The 1995 liver tumours and the 2000 differentiation block were both off-hypothesis results that became the next project.
- Own a gene, then own a catalogue. NAT1 bought independence; the ECAT list bought the screen.
- Negative results are retained as reagents. Fbx15 being dispensable is what made it a usable selection marker. Nanog being dispensable in the 2006 screen was reported, not buried — and then became the selection marker that fixed the 2007 germline problem.
- Invert the question when the direct one saturates. Maintenance → installation. Single genes → combinations.
Caveats on the reconstruction
- The corpus was disambiguated from 1,038 "Yamanaka S" PubMed records by per-author affiliation strings, iterative co-author networks, and topic filters; 275 survive. Several other researchers share the name (a Kyoto Prefectural cardiologist, a Gunma pathologist, a Tohoku thoracic surgeon, an Osaka City University materials physicist), and their papers were excluded on affiliation evidence. Spot-check
yamanaka_corpus_1990_2026.csvif precision matters for your use; per-record attribution scores and the evidence behind each decision are in that file. - Reference lists were available from Europe PMC for 53 of 69 pre-2008 papers; older J Biol Chem and Japanese-language items are the main gaps.
- Book chapters, Japanese-language reviews not indexed in PubMed, and his Nobel lecture are outside this corpus. His own retrospective accounts are worth reading alongside it — the record shows what he did; the essays explain what he was thinking while doing it.
Machine Traces of Discovery Paths #1 — Evidence 2 of 4 · Analysis findings
Verifiable source document for the Deep Dive essay Machine Traces of Discovery Paths #1. Findings derived from the trace corpus (Evidence 1). Also underpins Posts #3 and #4.
A methods-and-findings report on tracing Shinya Yamanaka's path to iPS cells from the primary literature. The narrative reconstruction lives in a companion report; this document covers what the analysis established, how reliably, and what the method itself taught us.
1. Summary
Three things came out of this work:
- A substantive finding. The iPS discovery is traceable as a causal chain of eight papers over twelve years, originating in a cholesterol-lowering experiment that failed. Every link is documented in the authors' own abstracts — this is not a retrospective narrative imposed on a bibliography.
- A methodological finding. Author disambiguation is where this kind of analysis lives or dies, and no single signal is sufficient. Removing per-author affiliation matching collapses the corpus from 275 papers to 27 — a 90% loss.
- Two systematic bugs, found only by generalizing. The hand-tuned version of this analysis produced the right answer through compensating errors. Both surfaced when the logic was made parameter-driven and re-run.
2. The corpus
| Quantity | Value |
|---|---|
| Raw PubMed records for "Yamanaka S" | 1,038 |
| Retained after disambiguation | 275 |
| Excluded as homonyms or out-of-scope | 763 (73%) |
| Bootstrapped lab roster (co-authors) | 208 |
| Reference lists retrieved | 53 of 69 pre-2008 papers (77%) |
| Span | 1990–2026 |
Nearly three-quarters of records bearing this author name belong to other people. Any analysis that skips disambiguation is analysing a composite of at least seven different researchers.
Career phases derived from the corpus
Phase boundaries were cut at affiliation changes and topic switches, both read off the corpus rather than a biography.
| Phase | Years | n | Median citations | Max |
|---|---|---|---|---|
| Osaka City University — pharmacology | 1990–1993 | 9 | 11 | 36 |
| Gladstone/UCSF — APOBEC-1 | 1994–1996 | 4 | 94 | 223 |
| NAT1; return to Osaka | 1997–1999 | 17 | 30 | 176 |
| NAIST — NAT1 knockout, ES cells, ECAT screen | 2000–2003 | 11 | 46 | 2,323 |
| NAIST/Kyoto — factor selection, mouse iPS | 2004–2006 | 15 | 83 | 18,417 |
| Kyoto/CiRA — human iPS, refinement | 2007–2009 | 32 | 141 | 14,161 |
| CiRA — clinical translation | 2010–2026 | 187 | 45 | 1,619 |
| Total | 275 |
Median citations per phase are non-monotonic: 11 → 94 → 30 → 46 → 83 → 141 → 45. The dip to 30 in 1997–1999 is the post-repatriation period analysed in §3.3 — it interrupts the rise rather than continuing it, and its cause is visible in the authorship data (3 of 17 papers first-authored). The fall to 45 after 2009 has a different cause: late-career volume is institutional output from a large centre, not a continuation of the discovery arc. Because the baseline moves in both directions, hinge-paper ranking must be done against the phase median rather than absolute counts. The 1997 NAT1 paper's 176 citations sit ~6× its phase median of 30, marking it as exceptional; in the 2010–2026 phase (median 45) 39 of 187 papers reach 176 or more, so the same absolute count there carries no comparable signal.
3. Substantive findings
3.1 The chain is real and it is documented
Eight papers, each generating the next through a result its authors flagged as unexpected:
| Year | Paper | The link forward |
|---|---|---|
| 1994 | APOBEC-1 cloned (J Biol Chem, 1st author) | editing specificity is not in the enzyme; auxiliary factors are ubiquitous |
| 1995 | Transgenic liver cancer (PNAS, 1st author) | the cholesterol experiment produced tumours instead |
| 1996 | Hyperediting (J Biol Chem, 1st author) | off-target editing is the mechanism — so which transcripts? |
| 1997 | NAT1 (Genes Dev, 1st author) | differential display answers it; he now owns a gene |
| 2000 | NAT1 knockout (EMBO J, 1st author) | null ES cells are normal but cannot differentiate |
| 2003 | Fbx15 / Nanog / ERas | ES-gene catalogue; Fbx15 dispensable → usable selection marker |
| 2006 | Mouse iPS (Cell, 2 authors) | question inverted: what installs pluripotency |
| 2007 | Germline + human iPS | Fbx15 selection incomplete; Nanog selection completes it |
3.2 The abstracts flag their own pivots
Searching the corpus for hedging and surprise vocabulary located the two structural hinges directly. The 1995 paper reports that unexpectedly, the transgenic animals developed liver dysplasia and carcinomas; the 2006 paper reports that unexpectedly, Nanog was dispensable. Both are the authors' own words in the abstract. An anomaly a researcher chooses to advertise in an abstract is a reliable marker of a research pivot — this turned out to be the single most efficient way to find the load-bearing transitions, and it generalizes.
3.3 Author position reveals a period with no independent program
Of 275 papers, 31 are first-authored, and they cluster in 1992–2000 and 2006–2009. The 1997–1999 window is the exception: 17 papers, only 3 first-authored, the rest middle-author contributions to another lab's cardiovascular MAP-kinase program. The corpus independently marks the difficult post-repatriation period he has described publicly — recoverable from authorship metadata alone, without reference to his own account.
3.4 A dispensable gene became the key reagent
Fbx15 (2003) has 192 citations — unremarkable, and its finding was negative: knockouts are normal. But self-citation analysis ranks it the most-cited paper by his own later work (17 internal citations, above the 2006 iPS paper's 11). A gene that does nothing is a pluripotency marker with no phenotype to confound a screen, which is exactly what a selection reporter must be. Ranking by external citations alone would have missed it; the internal citation graph surfaced it.
3.5 The enabling technology is invisible in the narrative
Ranking external works by how many of his own papers cite them surfaces the expected foundations — Evans & Kaufman and Martin on mouse ES cells (Evans, M. J. & Kaufman, M. H., 1981; Martin, G. R., 1981), Thomson on human ES cells (Thomson, J. A. et al., 1998), Nichols and Niwa on Oct3/4 (Nichols, J. et al., 1998; Niwa, H. et al., 2000) — and one that no narrative account mentions: the Plat-E retroviral packaging system (Morita, S. et al., 2000), cited in 7 of his pre-2008 papers. Delivering 24 candidate factors into fibroblasts is a throughput problem before it is a biology problem. Reference-frequency analysis makes the instrument visible.
4. Methodological findings
4.1 Disambiguation by additive evidence
No single signal separates homonymous authors. The method sums independent evidence and thresholds it:
| Evidence | Score |
|---|---|
| Target author's own affiliation matches a known institution | +3 |
| Target's own affiliation present but matches none | −3 |
| Any paper affiliation matches a known institution | +2 |
| Co-author overlap with bootstrapped lab roster | +1 each, cap +3 |
| Topic-vocabulary match | +1 |
| Hand-verified seed | +5 |
| Excluded-field keyword | −3 |
The −3 term is the load-bearing one and it requires per-author parsing. PubMed attaches affiliations to individual author entries, so a paper whose Yamanaka entry reads "Department of Thoracic Surgery, Tohoku University" is positive evidence of a different person. Only paper-level affiliation — which is what a naive parse yields — cannot express this.
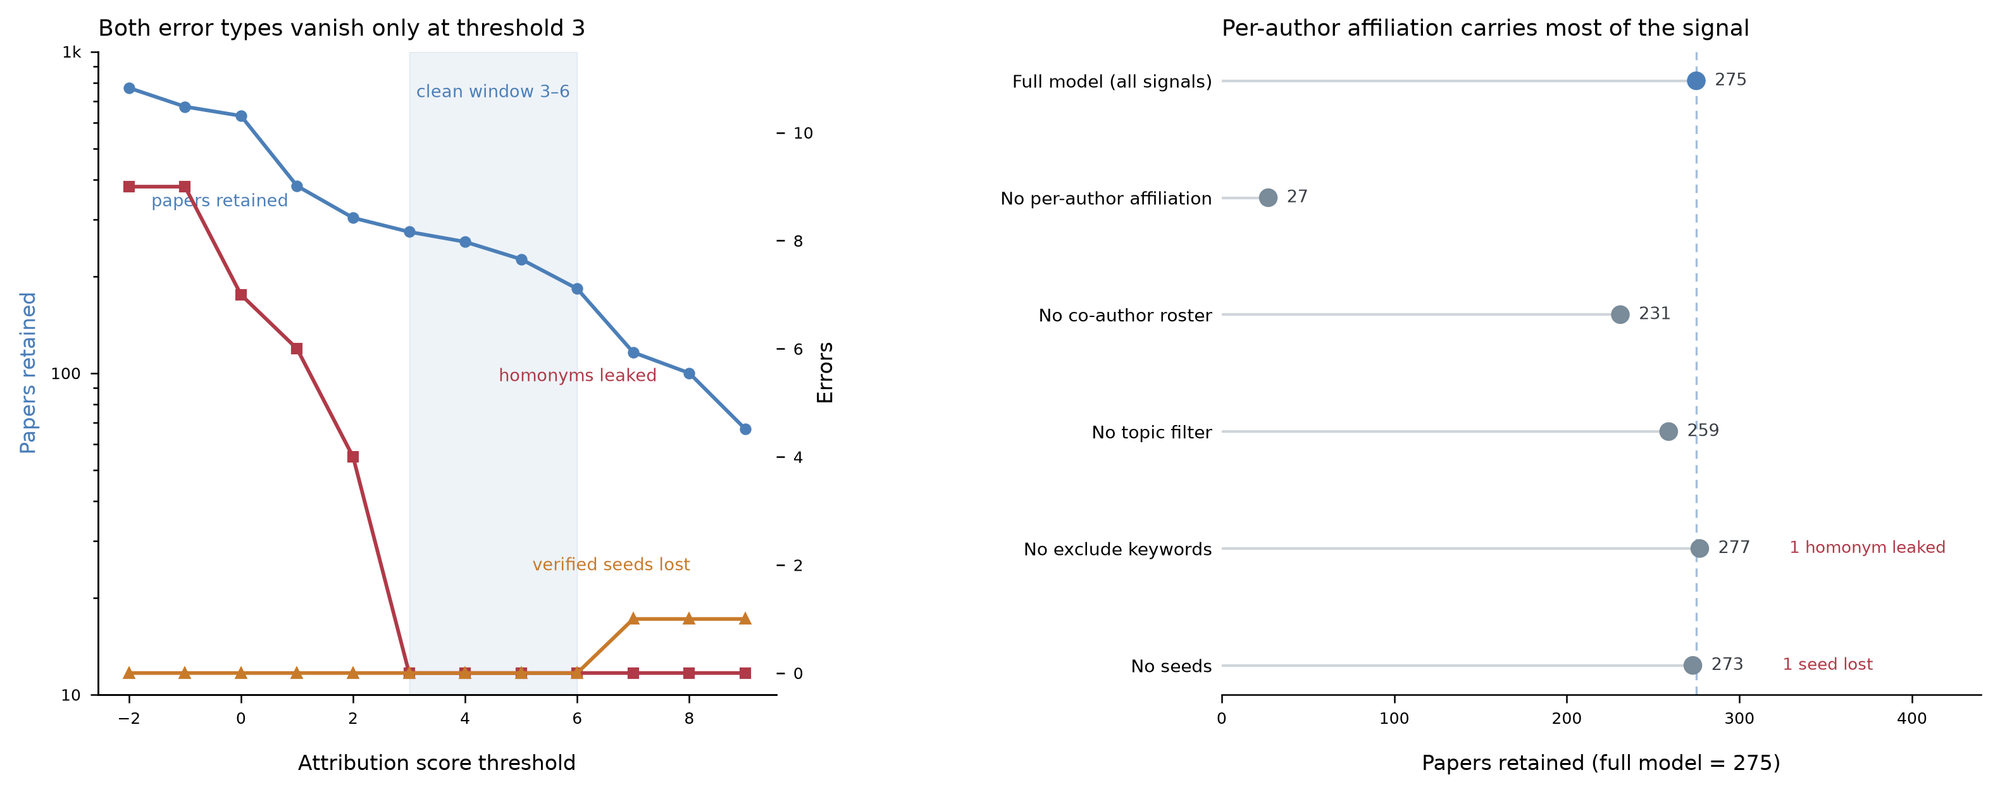
Validation
4.2 Threshold 3 is the unique clean setting
Sweeping the threshold from −4 to +10 (threshold_sensitivity.csv):
| Threshold | Retained | Seeds lost | Known homonyms leaked |
|---|---|---|---|
| 0 | 631 | 0 | 7 |
| 1 | 382 | 0 | 6 |
| 2 | 304 | 0 | 4 |
| 3 | 275 | 0 | 0 |
| 6 | 183 | 0 | 0 |
| 7 | 116 | 1 | 0 |
Threshold 3 is the lowest value at which no known homonym survives, and thresholds 3–6 are error-free in both directions. Above 6, verified landmark papers start dropping. The default is not tuned to this subject — it is the floor of a plateau three units wide.
4.3 Ablation: per-author affiliation carries the signal
Disabling one signal at a time (signal_ablation.csv):
| Configuration | Retained | Errors |
|---|---|---|
| Full model | 275 | none |
| No per-author affiliation | 27 | none, but 90% of the corpus lost |
| No co-author roster | 231 | none |
| No topic filter | 259 | none |
| No exclude keywords | 277 | 1 homonym leaked |
| No seeds | 273 | 1 landmark lost |
Affiliation matching is not one signal among several — without it the corpus is unusable. The co-author roster contributes the next 44 papers, and these are disproportionately pre-2000, where affiliation metadata is sparse or absent. That is precisely the early-career period where the chain originates, so the roster is what makes the origin recoverable at all.
4.4 Two bugs that a hand-tuned analysis concealed
Both were invisible until the logic was parameterized and re-run.
The subject's own name entered the co-author roster. Every record therefore scored a free +1, and four homonyms crossed the threshold — including a retracted visfatin paper, a Tokushima nutrition study, and an Osaka City University superconductivity paper. In the hand-tuned run, narrower institution keywords and a topic filter happened to mask this. Reproducing the bug on demand: 304 papers retained, 4 homonyms leaked, versus 275 and 0 after the fix.
Institution keywords match institutions, not departments. A large university hosts unrelated same-name researchers; the Osaka City University materials physicist scored +2 from a shared address. Mitigation is to put the other person's field in the exclusion list and let the target's own affiliation carry the positive signal.
The general lesson: a hand-tuned pipeline can be right for the wrong reasons. Making it parameter-driven and running it on a second subject is what exposed the compensating errors.
4.5 Recalled identifiers are unreliable
Validating on a second researcher (Ohsumi/autophagy), three of four seed PMIDs supplied from memory were unrelated papers — cell-matrix apoptosis, glial coupling, beclin-1. Seeds that match nothing were silently ignored, so the run looked fine. The scorer now warns on unmatched seeds, and the procedure requires fetching each seed and reading back its title and authors before use. A wrong-but-real identifier is worse: it warns nothing and anchors the roster on a stranger's lab.
4.6 Generalization
| Yamanaka / iPS | Ohsumi / autophagy | |
|---|---|---|
| Raw records | 1,038 | 314 |
| Retained | 275 | 209 |
| Roster size | 208 | 67 |
| Span | 1990–2026 | 1987–2025 |
| Off-topic retained | 0 known | 0 |
Default parameters transferred without adjustment. The Ohsumi corpus retains the pre-autophagy vacuolar H+-ATPase work (1987–1991), confirming the method does not truncate the early career — the failure mode that would destroy a discovery trace.
Concordance with the hand-tuned Yamanaka corpus is 274/275 (99.6%). Of the three differences, two are cases where the automated method is correct (a metformin colorectal-polyp trial and a Keio orthopaedic-surgery paper, both properly excluded); one is a genuine false positive at exactly the threshold (an EMBL Grenoble TDRD12 paper). It was left in rather than tuned away — adding a rule to defeat one borderline case is overfitting, and the audit step exists to catch this class.
5. Limits
- Attribution is inference, not ground truth. Per-record scores and evidence strings are in the corpus table; borderline rows need auditing before any precision claim.
- Reference coverage is 77% for the pre-2008 window. Pre-2000 and non-English records frequently have no machine-readable reference list. Gaps were reported, never imputed.
- The corpus is PubMed-only. Book chapters, non-indexed Japanese reviews, preprints, patents, and his Nobel lecture are invisible here.
- The record shows what was done, not why. Sequence and timing come from the corpus; motive comes from his essays and lectures, which are outside it. The two are attributed separately throughout.
- One validation subject is not a benchmark. Two subjects, both Japanese Nobel laureates in adjacent fields with distinctive institutional histories, is a weak test. Common surnames with no institutional separation between homonyms remain the hard case.
6. Reusable output
The procedure is published as the discovery-path-tracer skill: twelve helper functions (PubMed retrieval with per-author affiliation parsing, additive-evidence disambiguation, reference and citation mining, phase assignment, provenance generation), a seven-step workflow, and this analysis as a regression test with expected outputs.
Provenance
- Sources: NCBI E-utilities (PubMed) for records and metadata; Europe PMC REST for reference lists and citation counts. No manual curation of the corpus beyond the seed list and keyword parameters documented above.
- Query:
(Yamanaka S[au] OR Yamanaka Shinya[au])→ 1,038 records → 275 retained at threshold 3. - Citation counts retrieved 2026-08-12 and will drift.
- Validation subject:
(Ohsumi Y[au] OR Ohsumi Yoshinori[au])→ 314 records → 209 retained. - All scores, evidence strings, sweeps and ablations are in the accompanying CSVs; every number in this report is reproducible from them.
Machine Traces of Discovery Paths #1 — Evidence 3 of 4 · Protocol (extraction)
Verifiable source document for the Deep Dive essay Machine Traces of Discovery Paths #1, section "The protocol layer". Structured extraction of the NAT1 (2000, EMBO J) hinge experiment from the paper's Methods; nothing inferred, omissions listed in section 7 (Gaps). Also underpins Posts #3 and #4.
Paper: Essential role of NAT1/p97/DAP5 in embryonic differentiation and the retinoic acid pathway. Yamanaka S, Zhang X-Y, Maeda M, Miura K, Wang S, Farese RV Jr, Iwao H, Innerarity TL. PMID 11032820.
Scope of this extraction: the experimental chain that produced the conclusion "NAT1-null ES cells cannot differentiate" — the result that moved Yamanaka from RNA editing into stem-cell biology. Everything below is taken from the paper's own text. Nothing is inferred; procedural elements the paper omits are listed in §7 Gaps rather than filled in.
Locators: given as journal page (PDF page). Methods subsection titles are quoted as printed. The source is an OCR'd scan — values that survived OCR ambiguously are flagged inline.
1. Objective
| Question posed | What is the in vivo function of NAT1/p97/DAP5, the eIF4G-homologous translational repressor previously identified as an APOBEC-1 editing target? |
| Prior framing | NAT1 had been characterized in vitro and in transfected cells as a suppressor of global translation, therefore predicted to repress cellular proliferation — p5533 (p1). |
| Test | Disrupt the gene in mice and ask whether the predicted phenotype (impaired global translation/proliferation) appears. |
| Result that redirected the work | It did not. Undifferentiated NAT1−/− ES cells were normal in morphology, proliferation, global translation and expression profile; the defect was specific to differentiation — abstract, p5533 (p1); "Normal growth in undifferentiated NAT1−/− ES cells", p5535 (p3). |
| Conclusion drawn | NAT1 "functions as an essential determinant of specific gene expression pathways rather than a general suppressor of protein synthesis" — p5534 (p2). |
The differentiation phenotype was not the hypothesis under test. It was noticed incidentally while culturing cells off feeders to isolate DNA for genotyping (§3, step 4a).
2. Materials
2.1 Cells and animals
| Item | Specification | Locator |
|---|---|---|
| Parental ES line | RF8 mouse ES cells | "Targeted disruption…", p5539 (p7) |
| Feeder cells | STO cells (used to prevent ES differentiation) | Fig 3C, p5535 (p3) |
| Mice for germline transmission | Male chimeras × C57BL/6 females | p5534 (p2) |
| Teratoma hosts | Nude mice | "Histological analysis…", p5540 (p8) |
| ES clones used in assays | 3 × NAT1+/− and 3 × NAT1−/− (teratomas: 3 × +/−, 4 × −/−) | Figs 4, 5, 7, 8; p5540 (p8) |
2.2 Targeting construct — pRTV-NAT1
Design: positive–negative selection vector deleting exon 2, which carries the NAT1 translation initiation codon — p5539 (p7).
| Element | Detail |
|---|---|
| Genomic source | P1 bacteriophage clone, mouse NAT1 gene (Genome Systems, St Louis MO) |
| 5′ homology arm | 1.2 kb PCR fragment from intron 1 |
| 3′ homology arm | 5 kb PCR fragment, intron 2 → exon 18 |
| Positive selection | pgk-neo minigene, ligated between the two arms (replaces exon 2) |
| Negative selection | pgk-tk minigene, upstream of the 5′ arm |
| Linearization | SalI digestion before electroporation |
2.3 Genotyping reagents
Southern probe: 800 bp fragment from exon 1, labelled with [32P]dCTP. Diagnostic EcoRI fragments: 4.4 kb wild-type / 1.8 kb targeted — p5539 (p7).
Screening PCR (3 primers, one reaction): wild-type 1.6 kb, targeted 2 kb.
| Primer | Sequence (5′→3′) | Anneals to |
|---|---|---|
| S-U1 (sense) | CTTCCTCCCCCTTCCCTCCCCCTTTT |
exon 1 — amplifies both alleles, not randomly integrated vector |
| L39 (antisense) | TTTGTGTAGCCCTGCCTGTCCTG |
intron 2 — wild-type allele |
| S-L1 (antisense) | CCTGCGTGCAATCCATCTTGTTCAAT |
neo gene — targeted allele |
Routine genotyping PCR (mice, embryos, ES cells): wild-type 175 bp, targeted 0.7 kb.
| Primer | Sequence (5′→3′) | Anneals to |
|---|---|---|
| S-U4 (sense) | CTGCAGTGCTGGGAGCGGAAATAAAT |
intron 1 — both alleles |
| S-U (antisense) | TTTGGCGGCTTGACAACGAAGAATCT |
exon 2 — wild-type allele |
| S-L1 (antisense) | as above | neo — targeted allele |
PCR system: Expand Long Template (Boehringer Mannheim), manufacturer's protocol except 4% dimethylsulfoxide added — p5539 (p7). (OCR note: the S-U1 sequence appears hyphenated across a line break in the scan; the reading above is the concatenation as printed.)
2.4 Key reagents for the differentiation assays
| Reagent | Use | Stated value |
|---|---|---|
| G418 | homozygosing selection | 1.5 mg/ml |
| FIAU | negative selection during targeting | concentration not stated |
| all-trans retinoic acid (RA) | differentiation inducer | 3 × 10⁻⁷ M (morphology/proliferation); 1 × 10⁻⁶ M (reporter assay) |
| LIF | maintains ES cells off feeders (Fig 5A) | "1000 U/µl" as printed — almost certainly U/ml; see Gaps |
| Atlas mouse cDNA arrays (Clontech) | expression profiling | 588 genes |
| Reporters | DR2×2-tkm-FLuc, DR5-tkm-FLuc; pRL-TK (RLuc) | DR2/DR5 plasmids: gift from T. Ogura |
3. Procedure
Step 1 — Targeted disruption in ES cells
p5539 (p7); Results p5534 (p2)
- Linearize
pRTV-NAT1with SalI; introduce into RF8 ES cells by electroporation (procedure cited to Meiner, V. L. et al., 1996, not restated). - Select with G418 and FIAU (positive–negative).
- Screen G418-resistant colonies for homologous recombination by Southern blot (genomic DNA digested with EcoRI, separated on a 0.8% agarose gel, transferred to nylon membrane, hybridized with the exon-1 probe) and PCR.
- Confirm: 4.4 kb → 1.8 kb band shift (Southern); 1.6 kb → 2 kb (PCR).
Step 2 — Germline transmission and heterozygote characterization
p5534 (p2)
- Generate male chimeras from a correctly targeted clone (blastocyst injection performed by E. Sande — acknowledged, protocol not given); mate to C57BL/6 females; confirm germline transmission.
- Northern blot of hepatic total RNA: NAT1+/− mice show 50% lower NAT1 mRNA than wild-type littermates. Heterozygotes showed no detectable phenotype, including no increased tumour incidence.
Step 3 — Embryonic lethality (establishes that null is not viable)
p5534–5535 (p2–p3)
- Intercross NAT1+/− mice (>20 intercrosses); genotype offspring by PCR → no homozygous mice obtained.
- Analyse embryos E7.5–E10.5: ~20% poorly developed; PCR confirms these are NAT1−/−. At E11.5 no null embryos; 3/18 (16.7%) deciduae resorbing.
- Histology (see Step 7 protocol): 7/34 (20.5%) of E7.5 embryos lacked organized three primary germ layers — trophectoderm and primitive endoderm formed, mesoderm did not emerge from the epiblast → NAT1 is essential for gastrulation.
Step 4 — Derivation of NAT1−/− ES cells
"Generation of NAT1−/− ES cell clones", p5539 (p7); Results p5535 (p3)
- Plate NAT1+/− ES cells at 1 × 10⁶ cells per 100 mm dish.
- Culture in 1.5 mg/ml G418 (high-concentration selection for spontaneous loss of the second allele; method cited to Mortensen, R. M. et al., 1992).
- After 8 days, genotype surviving colonies by PCR. Result: 29 of 64 surviving colonies were NAT1−/−.
- Confirm null status by Southern blot and by Northern blot (NAT1 mRNA absent).
The incidental observation (4a). Genotyping required culturing colonies without STO feeder
cells to isolate DNA. Normal ES cells flatten under these conditions (partial differentiation);
29 of 64 clones instead remained small and tightly associated, and PCR showed that all 29 were
NAT1−/− while every remaining clone was NAT1+/− — p5536 (p4). This
perfect genotype–morphology concordance, discovered during a routine step, is what generated the
differentiation hypothesis. Steps 5–7 were designed to test it.
Step 5 — Baseline controls (establish the defect is differentiation-specific)
p5535 (p3)
- Undifferentiated morphology and growth: culture on STO feeders; plate 10,000 cells of three +/− and three −/− clones; count daily with a Coulter counter for 5 days → indistinguishable (Fig 3C, D).
- Global protein synthesis ("Estimation of total protein synthesis", p5539):
- Plate 1 × 10⁴ cells per well of 24-well plates on STO feeders; culture 5 days.
- Wash 2× PBS; incubate in Met/Cys-free ES medium 30 min.
- Replace with labelling medium: [35S]Met + [35S]Cys, final 0.14 mCi/ml; label 3 h.
- Wash 2× PBS; disperse in 100 µl 2.5% trypsin; add 400 µl 0.1 mg/ml BSA / 0.02% NaN₃.
- Count cells in 100 µl (Coulter); add 400 µl 20% TCA; 1 h on ice.
- Apply 5 µl to glass-fibre filter (Filtermat A, Wallac); wash 2× 10% TCA, 30 min, then 100% ethanol, 30 min; dry.
- Apply MeltiLex solid scintillator; count 35S on MicroBeta (Wallac). → no difference.
- IRES-dependent translation (bicistronic tk-promoter reporters ptk-DLuc-EMCV / -myc / -NAT1): 10 µg each electroporated into ~1 × 10⁷ cells per clone (3 +/−, 3 −/−); one quarter of transfected cells plated per well of 6-well plates on STO; FLuc/RLuc measured at 24 h → indistinguishable between genotypes.
Step 6 — Differentiation-induction assays (the core experiments)
p5536 (p4); Fig 5 legend
- Assay A — feeder withdrawal (RA-independent differentiation). Culture without STO cells, with LIF (Fig 5A). Score colony morphology. (Duration not stated — see Gaps.)
- Assay B — RA-induced differentiation. Treat with all-trans RA at 3 × 10⁻⁷ M for 4 days; score morphology (Fig 5B).
- Assay C — RA growth suppression. Plate 10,000 cells of three +/− and three −/− clones; maintain undifferentiated on STO or induce with RA; count at 5 days. Averages ± SD of three clones; experiment repeated four times with consistent results (Fig 5C).
Step 7 — Teratoma assay (differentiation capacity in vivo)
"Histological analysis of embryos and teratocarcinomas", p5540 (p8); Results p5536 (p4)
- Inject 2 × 10⁶ cells subcutaneously into hind flanks of nude mice; three NAT1+/− and four NAT1−/− clones.
- After 3 weeks, dissect, weigh, and process histologically.
- Histology (same protocol as embryos): fix in 10% buffered formalin → paraffin-embed → section → haematoxylin and eosin.
- Score each tumour for derivatives of all three primary germ layers.
Step 8 — Molecular readouts of the differentiation program
p5536–5538 (p4–p6); Methods p5540 (p8)
- cDNA arrays: synthesize 32P-labelled cDNA probes from total RNA; hybridize to Atlas mouse cDNA arrays (588 genes); analyse on phosphorimager (Fuji BAS2500); normalize each gene to the sum of nine housekeeping genes. RNA from three clones per group, pooled. Differentiation induced by RA for 5 days.
- Northern blots for the responsive genes (method cited to Yamanaka, S. et al., 1997).
- RA-response-element reporters: DR2×2-tkm-FLuc and DR5-tkm-FLuc, with tk / SV40 / pgk / pol II promoter reporters as controls. 10 µg each + 0.3 µg pRL-TK, electroporated into ~1 × 10⁷ cells per clone (3 +/−, 3 −/−); one quarter plated per well of 6-well plates; maintained undifferentiated on STO or treated with RA 1 × 10⁻⁶ M; FLuc/RLuc at 24 h, normalized to RLuc.
4. Readout / Assay
| # | Assay | Measured quantity | Result |
|---|---|---|---|
| R1 | Feeder-withdrawal morphology | flattening vs. remaining small/tightly associated | 29/64 clones failed to flatten; all 29 were NAT1−/− |
| R2 | RA morphology (3 × 10⁻⁷ M, 4 d) | spreading/enlargement | +/− spread and enlarged; −/− "remained for the most part small and highly associated" |
| R3 | RA growth suppression (5 d) | cell number (Coulter) | RA slowed +/− markedly; effect "much smaller" in −/− |
| R4 | Teratoma mass | tumour weight | +/− 0.71 ± 0.42 g; −/− 0.54 ± 0.35 g — similar |
| R5 | Teratoma histology (H&E) | tissues of the three germ layers | +/−: columnar epithelium (endoderm), neural + squamous epithelium (ectoderm), striated muscle, cartilage, bone (mesoderm). −/−: mainly undifferentiated cells and neuroectoderm with rosettes and abundant mitoses; squamous epithelium with little keratinization; columnar epithelium lacking ciliary/mucous cells; no striated muscle or cartilage in any of 14 tumours from 4 clones |
| R6 | cDNA array (588 genes) | fold change on RA, normalized to 9 housekeeping genes | +/−: 19 genes increased >3-fold. −/−: none of 588 changed >3-fold |
| R7 | Northern blots | per-gene fold change | +/−: 9 genes induced (IGF-2, keratin 19, tPA, cyclin D2, collagen IV, PN1, c-jun, p21WAF1, cathepsin D), 2 reduced (Oct3/4, Sox2) >3-fold. −/−: IGF-2 and PN1 impaired basally and on induction; keratin 19, tPA, cyclin D2, c-jun, p21WAF1, cathepsin D normal basally but induction impaired; Oct3/4 repression impaired; collagen IV and pax6 induction unaffected |
| R8 | DR2 / DR5 reporters (RA 1 × 10⁻⁶ M, 24 h) | FLuc/RLuc | transcription from both RA-response elements impaired in −/−; control promoters (tk, SV40, pgk, pol II) included |
Note R7's internal control: collagen IV and pax6 induction are normal, which the authors read as evidence for NAT1-independent cascades — and which matches R5, where neuroectoderm was the one lineage that formed in null teratomas. The two independent readouts agree on which branch survives.
5. Judgment criteria — how "cannot differentiate" was established
The paper does not define a single quantitative threshold for the phenotype. The conclusion rests on five independent criteria applied to matched clone sets:
- Genotype–morphology concordance (R1). All 29 non-flattening clones were null; all flattening clones were heterozygous. Categorical, complete separation, n = 64 clones.
- Failure to respond to a canonical inducer (R2, R3). Both the morphological and the growth-suppressive response to RA were reduced relative to NAT1+/− controls.
- Loss of lineage output in vivo (R5). Absence of striated muscle and cartilage in 14/14 tumours from 4 independent clones — an absolute, countable criterion, and the strongest single line of evidence.
- Transcriptional program failure (R6). The >3-fold threshold, applied to 588 genes: 19 responders in +/− vs. zero in −/−.
- Loss of pluripotency-exit markers (R7). Failure to repress Oct3/4 and Sox2 on RA, read as a block at "very early steps of ES cell differentiation".
Control design worth noting. The comparator throughout is NAT1+/− clones that had survived the same high-G418 selection (p5536, p4), not naive wild-type ES cells. This controls for artefacts of the selection itself — a necessary control given that the null clones were obtained by drug-driven loss of heterozygosity.
Directionality of the claim. The authors state NAT1 is "essential for ES cell differentiation" (p5536) and "important for proper differentiation of all three primary germ layers" (p5536), while explicitly noting that neural differentiation still occurred. The claim as written is impaired, lineage-selective differentiation — not a total block.
6. Conditions — values explicitly stated
| Parameter | Value | Where |
|---|---|---|
| G418, homozygosing selection | 1.5 mg/ml, 8 days | Methods p5539 |
| Plating density for that selection | 1 × 10⁶ cells / 100 mm dish | Methods p5539 |
| RA, morphology assay | 3 × 10⁻⁷ M, 4 days | Fig 5B legend, p5536 |
| RA, proliferation assay | concentration not restated; 5 days | Fig 5C legend, p5536 |
| RA, array/Northern | 5 days (concentration not restated) | Fig 7A legend, p5538 |
| RA, reporter assay | 1 × 10⁻⁶ M, 24 h | Methods p5540; Fig 8 legend |
| LIF (feeder-free assay) | "1000 U/µl" as printed | Fig 5A legend, p5536 |
| Proliferation assay seeding | 10,000 cells; counted daily 5 days | Fig 3D, 5C |
| 35S labelling | 0.14 mCi/ml final, 3 h, after 30 min depletion | Methods p5539 |
| Protein-synthesis plating | 1 × 10⁴ cells/well, 24-well, 5 days on STO | Methods p5539 |
| Electroporation input (reporters) | 10 µg plasmid (+0.3 µg pRL-TK) into ~1 × 10⁷ cells | Methods p5539–5540 |
| Teratoma inoculum | 2 × 10⁶ cells, subcutaneous, hind flanks | Methods p5540 |
| Teratoma endpoint | 3 weeks | Methods p5540 |
| Southern | EcoRI digest, 0.8% agarose, nylon membrane, 800 bp exon-1 probe | Methods p5539 |
| PCR additive | 4% DMSO | Methods p5539 |
| Fixation | 10% buffered formalin, paraffin, H&E | Methods p5540 |
| Array normalization | sum of nine housekeeping genes | Methods p5540 |
| Replication | 3 clones/genotype (4 null for teratomas); Fig 5C repeated 4× | Fig legends |
7. Gaps — not stated in the paper; required for reproduction
7.1 Culture conditions (the largest gap)
- ES cell medium composition is never given — base medium, serum type and percentage, 2-mercaptoethanol, non-essential amino acids, glutamine. Only "ES cell medium" is referenced (Methods p5539).
- LIF concentration for routine maintenance not stated; the one LIF figure (Fig 5A) prints "1000 U/µl", which is ~1000× typical usage and is almost certainly U/ml — either an original typographical error or an OCR artefact of this scan. Do not adopt the printed value.
- STO feeder preparation — mitotic inactivation method (mitomycin C vs. irradiation), dose, plating density, and whether gelatin coating was used: none stated.
- Passage number / culture history of the ES clones is not reported.
7.2 Assay parameters
- Feeder-withdrawal assay (Assay A) has no stated duration, no seeding density, and no scoring rubric — yet it produced the founding 29/64 observation.
- RA concentration is not restated for the proliferation assay (Fig 5C) or for the array/Northern experiments (Fig 7). Two different concentrations appear elsewhere (3 × 10⁻⁷ M and 1 × 10⁻⁶ M), so the value used in these two experiments is genuinely ambiguous.
- RA handling — vehicle (DMSO/ethanol), stock concentration, light protection, medium-change frequency during the 4–5 day treatments: not stated. RA is light- and oxidation-labile, so this materially affects reproducibility.
- Electroporation parameters (voltage, capacitance, cuvette, cell suspension buffer) are not given; cited to Meiner, V. L. et al., 1996.
- FIAU concentration for negative selection is not stated. The G418 concentration used during the original targeting is also not given (only the 1.5 mg/ml homozygosing step).
- Northern blot protocol is cited to Yamanaka, S. et al., 1997 rather than restated.
- Blastocyst injection protocol is absent; the work is credited to E. Sande in Acknowledgements.
7.3 Selection and analysis of clones
- Which 3 of the 29 null clones (and which heterozygous clones) entered each assay, and how they were chosen, is not stated. Teratomas used 4 null clones — the relationship to the 3 used elsewhere is unspecified.
- How 14 tumours arose from 4 clones (injections per clone, per mouse, bilateral or not) is not stated; nor are nude mouse strain, age, or sex.
- No statistical test is reported anywhere. Figures show mean ± SD of three clones; Fig 5C notes four repetitions "with consistent results". No p-values, no test specified, no power consideration.
- cDNA array RNA was pooled across three clones per group, so clone-to-clone variance in the array data is unrecoverable, and the "none of 588 genes >3-fold" claim rests on a single pooled comparison per genotype.
7.4 Missing controls that bear on the central claim
- No genetic rescue. NAT1 is not re-expressed in null cells to show the differentiation defect is reverted. The causal link between NAT1 loss and the phenotype rests on correlation across clones plus the heterozygote control.
- No karyotype analysis of the null clones. They were derived by high-concentration G418 selection, which can select for aneuploidy — and aneuploidy independently impairs differentiation. The +/−-survived-the-same-selection control mitigates but does not exclude this.
- No chimera or germline test of the NAT1−/− ES cells (the assay Yamanaka would later make central to iPS validation in 2007).
- Off-feeder differentiation was not characterized molecularly — Assay A is scored by morphology only; no marker panel is applied to it.
7.5 Provenance caveat on this extraction
The source PDF is a scanned, OCR'd copy. Sequence strings, superscripts and exponents are the most OCR-fragile elements: exponents in the scan appear as e.g. "3 X 10⁻⁷ M" and "1 X 10⁶ M", read here as 3 × 10⁻⁷ M and 1 × 10⁻⁶ M respectively from context. Verify all primer sequences and all concentrations against a clean copy of record before bench use.
8. Position in the discovery chain
This paper is the hinge. The route in is APOBEC-1: NAT1 was found in 1997 (Genes Dev) as a transcript hyperedited in the liver tumours of APOBEC-1 transgenic mice, and this knockout was built to test its predicted role as a global translational repressor. That prediction failed — §1 — and what remained was a differentiation phenotype in ES cells.
Two elements of the technique carried forward directly into the 2006 iPS screen: ES cell culture competence (acquired here to characterize a lipid-adjacent gene), and the teratoma three-germ-layer histology assay (§3 step 7), which became the standard test of pluripotency (Takahashi, K. & Yamanaka, S., 2006). The gene that occasioned the work, NAT1, does not appear in the four factors.
Machine Traces of Discovery Paths #1 — Evidence 4 of 4 · Protocol (bench)
Verifiable source document for the Deep Dive essay Machine Traces of Discovery Paths #1, section "The protocol layer". Executable reconstruction of the NAT1 (2000) experiment; every parameter tagged [P] paper / [S] supplied / [M] modern. Also underpins Posts #3 and #4.
Reconstructed from: Yamanaka S, Zhang X-Y, Maeda M, Miura K, Wang S, Farese RV Jr, Iwao H, Innerarity TL. Essential role of NAT1/p97/DAP5 in embryonic differentiation and the retinoic acid pathway. EMBO J 2000;19(20):5533–5541. PMID 11032820.
Purpose: an executable version of the experimental chain that established that NAT1-null mouse ES cells are normal when undifferentiated but fail to differentiate properly.
How to read this document
Every parameter carries a provenance tag. This distinction is the point of the document — do not strip it.
| Tag | Meaning |
|---|---|
| [P] | Stated in the paper. Value is as published; locator given in the extraction companion. |
| [S] | Supplied. Absent from the paper; filled with a period-standard (c. 2000) value so the protocol runs. Rationale given inline. A [S] value is a starting point to validate in your hands, not a reproduction of what the authors did. |
| [S⚠] | Supplied, and the paper's printed value looks wrong. See §0.2. |
| [M] | Modern addition. Not in the original; included because current practice or the paper's own gaps (§7.4 of the extraction) require it for the result to be interpretable. |
Before starting: all animal work here (mouse breeding, embryo dissection, teratoma formation in nude mice) requires prior institutional animal-ethics approval — IACUC or your national/local equivalent — plus appropriate biosafety registration for the retroviral-free but transgenic mouse lines. Radioisotope steps (32P, 35S) require a licensed facility and personal dosimetry. This document is a research protocol, not authorization to perform the work.
§0 Critical notes before you begin
0.1 The phenotype is subtle and control-dependent
The central claim rests on a comparison between genotypes within the same selection history, not on an absolute measurement. NAT1−/− clones were obtained by high-G418 selection for loss of the remaining wild-type allele, so the mandatory comparator is NAT1+/− clones that survived the identical selection [P] — never naive wild-type ES cells. If you substitute a naive control, any difference you see may be a selection artefact.
0.2 Two published values that should not be adopted as printed
- LIF "1000 U/µl" (Fig 5A legend). This is ~1000× normal usage. Use 1000 U/ml [S⚠]. Treat as a units typographical error in the original (or an OCR artefact of the scanned copy consulted).
- RA concentration is inconsistent across experiments. The paper states 3 × 10⁻⁷ M for morphology [P] and 1 × 10⁻⁶ M for the reporter assay [P], and does not restate it for the proliferation assay (Fig 5C) or the array/Northern experiments (Fig 7). This protocol uses 3 × 10⁻⁷ M for all differentiation assays [S] and flags the ambiguity where it arises. Run a dose–response first (§6.0).
0.3 What the original lacked, and what §9 adds
The paper includes no genetic rescue, no karyotype analysis, and no statistical testing (see extraction §7.4). A differentiation defect in aneuploid clones is a well-known confounder, and high-concentration G418 selection can enrich for aneuploidy. §9 is not optional if you intend to claim causality.
§1 Materials
1.1 Cells and animals
| Item | Specification | Tag |
|---|---|---|
| Parental ES line | RF8 mouse ES cells | [P] |
| Feeder cells | STO fibroblasts | [P] |
| Feeder inactivation | Mitomycin C 10 µg/ml, 2–3 h, 37 °C; wash 3× PBS — or γ-irradiation 3000–5000 rad | [S] both were standard c. 2000; mitomycin C is the lower-equipment option |
| Feeder plating density | 3–5 × 10⁴ cells/cm² on 0.1% gelatin | [S] standard for ES support |
| Breeding | Male chimeras × C57BL/6 females | [P] |
| Teratoma hosts | Nude mice; BALB/c nu/nu or CD-1 nu/nu, 6–8 wk, sex-matched within experiment | strain [P] "nude mice"; substrain/age/sex [S] |
1.2 ES cell medium ([S] — the paper never gives this)
The paper refers only to "ES cell medium". The following is the standard 2000-era formulation for feeder-dependent mouse ES cells. Serum lot-test before committing (see §2.1).
| Component | Final | Note |
|---|---|---|
| DMEM, high glucose (4.5 g/l) | base | |
| Fetal bovine serum, ES-qualified | 15% | lot-tested; the single largest source of variability |
| L-glutamine | 2 mM | |
| MEM non-essential amino acids | 1× | |
| Sodium pyruvate | 1 mM | |
| 2-mercaptoethanol | 0.1 mM | add fresh; ES cells are acutely sensitive |
| Penicillin/streptomycin | 1× | |
| LIF | 1000 U/ml | [S⚠] see §0.2 |
Differentiation-permissive medium: identical, minus LIF. [S]
1.3 Key reagents
| Reagent | Working value | Tag |
|---|---|---|
| G418 — targeting selection | 200–400 µg/ml (active) | [S] paper gives only the homozygosing concentration |
| G418 — homozygosing selection | 1.5 mg/ml, 8 days | [P] |
| FIAU — negative selection | 0.2 µM | [S] standard for pgk-tk counterselection |
| all-trans retinoic acid | 3 × 10⁻⁷ M working; 10 mM stock in DMSO, −80 °C, single-use aliquots, handle under dimmed/yellow light, protect plates from light, refresh medium daily | working conc. [P]; all handling detail [S] — RA is light- and oxidation-labile and this is the most common cause of failed replication |
| Gelatin | 0.1% in water, autoclaved | [S] |
| Trypsin (cell dispersal, 35S assay) | 2.5% | [P] |
| Trypsin (routine passage) | 0.05% trypsin-EDTA | [S] 2.5% is the assay-specific concentration, not for routine use |
1.4 Targeting vector pRTV-NAT1 [P]
Deletes exon 2 (contains the NAT1 initiation codon).
- Genomic source: P1 bacteriophage clone, mouse NAT1 (Genome Systems)
- 5′ arm: 1.2 kb from intron 1 · 3′ arm: 5 kb, intron 2 → exon 18
- pgk-neo between arms (replaces exon 2); pgk-tk upstream of 5′ arm
- Linearize with SalI before electroporation
1.5 Genotyping primers [P] — verify against a clean copy of record before ordering
Screening PCR (3 primers, one reaction): wild-type 1.6 kb / targeted 2 kb
| Primer | Sequence (5′→3′) | Target |
|---|---|---|
| S-U1 | CTTCCTCCCCCTTCCCTCCCCCTTTT |
exon 1 (both alleles; not random integrant) |
| L39 | TTTGTGTAGCCCTGCCTGTCCTG |
intron 2 (wild-type) |
| S-L1 | CCTGCGTGCAATCCATCTTGTTCAAT |
neo (targeted) |
Routine genotyping PCR: wild-type 175 bp / targeted 0.7 kb
| Primer | Sequence (5′→3′) | Target |
|---|---|---|
| S-U4 | CTGCAGTGCTGGGAGCGGAAATAAAT |
intron 1 (both alleles) |
| S-U | TTTGGCGGCTTGACAACGAAGAATCT |
exon 2 (wild-type) |
| S-L1 | as above | neo (targeted) |
Cycling: Expand Long Template system (Boehringer Mannheim, now Roche), manufacturer's protocol + 4% DMSO [P]. Cycling parameters per manufacturer [S — not specified in paper].
§2 Stage 1 — Targeted disruption (≈6–8 weeks)
2.1 Pre-flight QC [M]
Do this before consuming the targeting vector.
- Lot-test FBS: plate ES cells in 3–4 candidate lots; select the lot giving the highest fraction of compact, alkaline-phosphatase-positive, undifferentiated colonies.
- Confirm parental RF8 karyotype (≥80% cells 40,XY) — establishes the baseline for §9.2.
- Confirm feeder inactivation: mock-plate inactivated STO alone; no proliferation over 7 days.
2.2 Electroporation and selection
- Linearize
pRTV-NAT1with SalI; phenol/chloroform extract; ethanol precipitate; resuspend in PBS [P: SalI / S: cleanup]. - Harvest RF8 ES cells to single-cell suspension; resuspend 1 × 10⁷ cells in 0.8 ml PBS with 25 µg linearized vector [S — the paper cites Meiner, V. L. et al., 1996 without restating].
- Electroporate: 250 V, 500 µF, 0.4 cm cuvette [S — standard Bio-Rad Gene Pulser settings of the period].
- Rest 10 min at room temperature; plate onto inactivated STO feeders [S].
- From 24 h: select in G418 200–400 µg/ml + FIAU 0.2 µM [S]; refresh daily; continue 7–10 days [S].
- Pick surviving colonies into 96-well plates; duplicate — one plate for freezing, one for DNA [S].
2.3 Identify correct recombinants [P]
- Southern blot: digest genomic DNA with EcoRI; 0.8% agarose; transfer to nylon; hybridize with the 800 bp exon-1 probe labelled with [32P]dCTP.
→ wild-type 4.4 kb / targeted 1.8 kb - Confirm by screening PCR (§1.5): 1.6 kb / 2 kb.
Checkpoint A. Proceed only with clones positive by both Southern and PCR. The S-U1 primer is
deliberately designed not to amplify randomly integrated vector — a PCR-positive/Southern-negative
clone is a random integrant, not a recombinant.
§3 Stage 2 — Germline transmission (≈4–6 months) — optional for the ES phenotype
Required only if you need embryos (§4). The differentiation phenotype in §6–§7 can be obtained entirely from ES cells (§5) without any mouse work — worth knowing before committing to a mouse colony.
- Inject targeted ES clone into blastocysts; transfer to pseudopregnant females [P — performed by a
named collaborator; no protocol given. Use your transgenic core.] - Breed male chimeras × C57BL/6 [P]; genotype offspring by routine PCR (§1.5).
- Confirm heterozygosity: Northern blot of hepatic total RNA → ~50% of wild-type NAT1 mRNA [P].
Expected: heterozygotes are phenotypically normal, with no increased tumour incidence [P].
§4 Stage 3 — Embryonic lethality (optional; establishes null is non-viable)
- Intercross NAT1+/− × NAT1+/−; genotype offspring by PCR.
→ Expected: no homozygous live pups (paper: >20 intercrosses) [P]. - Dissect embryos E7.5–E10.5. → ~20% poorly developed; PCR confirms NAT1−/− [P].
- At E11.5: no null embryos recoverable; ~16.7% (3/18) of deciduae resorbing [P].
- Histology: dissect deciduae from uterus → fix 10% buffered formalin → paraffin → section → H&E [P].
→ Expected: ~20% (7/34) of E7.5 embryos lack organized three germ layers; trophectoderm and primitive endoderm form but mesoderm fails to emerge from the epiblast [P].
§5 Stage 4 — Derive NAT1−/− ES clones (≈2 weeks) — the key enabling step
- Plate NAT1+/− ES cells at 1 × 10⁶ cells per 100 mm dish [P].
- Culture in G418 1.5 mg/ml [P] (~4–5× the targeting concentration; selects for spontaneous loss of the wild-type allele via gene conversion/non-disjunction).
- Refresh selection medium every 2 days [S]; maintain 8 days [P].
- Pick surviving colonies; genotype by routine PCR [P].
→ Expected yield: ~45% null. Paper obtained 29 of 64 surviving colonies as NAT1−/− [P]. - Confirm by Southern blot and by Northern blot (NAT1 mRNA absent in nulls) [P].
Checkpoint B — capture the founding observation. Genotyping requires expanding colonies
without feeders. Score morphology at this step before you do anything else: normal ES cells
flatten (partial differentiation); NAT1−/− cells remain small and tightly associated
[P]. In the original this correlated perfectly with genotype (29/29). Photograph every colony
here. This is the observation the entire paper was built on, and it is free.
Checkpoint C [M]. Karyotype all clones taken forward (§9.2) before running §6–§7. High-G418
selection enriches for aneuploidy, and aneuploidy alone impairs differentiation.
Clone set to carry forward: ≥3 NAT1+/− and ≥3 NAT1−/− independent clones, all from the same selection [P]. Use 4 null clones if teratomas are planned [P].
§6 Stage 5 — Differentiation assays (the core experiments)
6.0 Dose–response first [M]
The paper's RA concentration is ambiguous across experiments (§0.2). Before the definitive runs, titrate RA at 10−8–10−6 M on NAT1+/− cells and pick the lowest concentration giving unambiguous flattening by day 4. Use that concentration throughout, and report it.
6.1 Baseline controls — establish the defect is differentiation-specific [P]
These must be run and must be negative. The claim is not "null cells are sick"; it is "null cells are normal until asked to differentiate."
(a) Undifferentiated morphology and growth
- Seed 10,000 cells per well of 3 +/− and 3 −/− clones on STO feeders, +LIF.
- Count daily with a Coulter counter (or haemocytometer) for 5 days.
- → Expected: indistinguishable morphology and growth curves.
(b) Global protein synthesis — 35S incorporation
- Seed 1 × 10⁴ cells/well, 24-well plates, on STO; culture 5 days.
- Wash 2× PBS; incubate in Met/Cys-free ES medium 30 min.
- Replace with labelling medium: [35S]Met + [35S]Cys, 0.14 mCi/ml final; 3 h.
- Wash 2× PBS; disperse in 100 µl 2.5% trypsin; add 400 µl 0.1 mg/ml BSA + 0.02% NaN₃.
- Count cells in 100 µl; add 400 µl 20% TCA; 1 h on ice.
- Apply 5 µl to glass-fibre filter; wash 2× 10% TCA 30 min, then 100% ethanol 30 min; dry.
- Solid scintillator; count 35S. → Expected: no difference between genotypes.
(c) IRES-dependent translation — bicistronic tk-promoter reporters (EMCV / c-myc / NAT1 IRES)
- 10 µg reporter into ~1 × 10⁷ cells per clone by electroporation.
- Plate one quarter of transfected cells per well, 6-well, on STO.
- Measure FLuc/RLuc at 24 h. → Expected: *indistinguishable between genotypes.
6.2 Assay A — feeder withdrawal (RA-independent differentiation)
⚠ This assay produced the founding observation but is the least specified in the paper (extraction §7.2): no duration, no seeding density, no scoring rubric.
| Parameter | Value | Tag |
|---|---|---|
| Condition | no STO feeders; +LIF 1000 U/ml | [P] condition; [S⚠] concentration |
| Substrate | 0.1% gelatin | [S] |
| Seeding | 500–1000 cells per well, 6-well (colonies must stay separable) | [S] |
| Duration | score days 3, 5, 7 | [S] — paper gives none; a time course removes the guess |
| Scoring | ≥100 colonies/clone, blinded to genotype, categorized flattened / intermediate / compact | [M] |
→ Expected: NAT1+/− flatten; NAT1−/− remain small and tightly associated [P].
6.3 Assay B — RA-induced differentiation morphology [P]
- Treat with all-trans RA 3 × 10⁻⁷ M for 4 days; refresh medium + RA daily [S].
- → Expected: +/− cells spread and enlarge; −/− cells "remain for the most part small and highly associated".
- Photograph ≥5 fields per clone, fixed exposure, blinded scoring [M].
6.4 Assay C — RA growth suppression [P]
- Seed 10,000 cells of each of 3 +/− and 3 −/− clones.
- Two arms: maintained undifferentiated on STO vs RA-induced.
- Count at 5 days. Report mean ± SD of the three clones.
- Paper repeated this 4 independent times with consistent results [P] — match that.
- → Expected: RA markedly slows +/−; effect "much smaller" in −/−.
§7 Stage 6 — Teratoma assay (≈4 weeks) — the strongest single readout
- Inject 2 × 10⁶ cells subcutaneously into hind flanks of nude mice; 3 NAT1+/− and 4 NAT1−/− clones [P].
- Injections per clone: [S — paper reports 14 tumours from 4 null clones, so ~3–4 sites per clone; plan 4 sites per clone, bilateral flanks, 2 mice per clone.]
- Monitor per your animal protocol; humane endpoints for tumour burden apply [M].
- At 3 weeks: dissect, weigh, fix in 10% buffered formalin, paraffin, section, H&E [P].
- Score each tumour for derivatives of all three germ layers, blinded to genotype [M].
Expected results [P]:
| NAT1+/− | NAT1−/− | |
|---|---|---|
| Tumour weight | 0.71 ± 0.42 g | 0.54 ± 0.35 g (similar — this is a control, not the readout) |
| Endoderm | columnar epithelium | present but lacking ciliary/mucous cells |
| Ectoderm | neural tissue, squamous epithelium | neuroectoderm with rosettes + abundant mitoses; squamous epithelium with little keratinization |
| Mesoderm | striated muscle, cartilage, bone | no striated muscle or cartilage in any of 14 tumours from 4 clones |
This is the criterion that carries the claim — an absolute, countable absence (14/14), not a
difference of degree. Note that tumour mass is equivalent between genotypes: the null cells grow
fine, they just do not differentiate. Sample multiple sections per tumour before recording an
absence [M].
§8 Stage 7 — Molecular readouts
8.1 Expression profiling [P]
- Induce differentiation with RA, 5 days (concentration not restated in the paper — use your §6.0 value and report it) [S].
- Synthesize 32P-labelled cDNA from total RNA; hybridize to a 588-gene mouse cDNA array (originally Atlas/Clontech — discontinued; substitute RNA-seq or a current array [M]).
- Normalize each gene to the sum of nine housekeeping genes [P].
- ⚠ The original pooled RNA from three clones per group [P], which destroys clone-level variance. Process clones separately [M] — this is what makes statistics possible at all.
- → Expected: 19 genes >3-fold in +/−; none of 588 in −/− [P].
8.2 Northern blot / qPCR panel [P]
Genes changing >3-fold on RA in NAT1+/−:
| Direction | Genes | Behaviour in NAT1−/− |
|---|---|---|
| Induced | IGF-2, PN1 | impaired basally and on induction |
| Induced | keratin 19, tPA, cyclin D2, c-jun, p21WAF1, cathepsin D | normal basal, induction impaired |
| Induced | collagen IV | induction normal (NAT1-independent cascade) |
| Induced (transient, d2) | pax6 | induction normal — consistent with neuroectoderm forming in null teratomas |
| Repressed | Oct3/4, Sox2 | repression impaired → block at very early exit from pluripotency |
The collagen IV / pax6 internal controls matter: they show the defect is lineage-selective, not
a global failure, and they agree with the teratoma histology on which branch survives. Report them.
8.3 RA-response-element reporters [P]
- Constructs: DR2×2-tkm-FLuc and DR5-tkm-FLuc; controls: FLuc under tk, SV40, pgk, pol II promoters.
- 10 µg each + 0.3 µg pRL-TK into ~1 × 10⁷ cells per clone (3 +/−, 3 −/−) by electroporation.
- Plate one quarter per well, 6-well. Arms: undifferentiated on STO vs RA 1 × 10⁻⁶ M.
- FLuc/RLuc at 24 h, normalized to RLuc.
- → Expected: transcription from both RA-response elements impaired in nulls; control promoters unaffected.
§9 Additions required for a causal claim [M]
The original paper contains none of the following. Without §9.1 and §9.2 the result is a correlation between genotype and phenotype across clones.
9.1 Genetic rescue — the decisive missing experiment
Re-express NAT1 in ≥2 independent null clones (stable transfection or lentiviral, with an empty-vector control) and re-run §6.3, §6.4 and §8.2. Reversion of the differentiation defect is what converts correlation into causation. Include a catalytically/structurally relevant mutant if you want to map the requirement.
9.2 Karyotype
Metaphase spreads, ≥20 per clone, on every clone entering §6–§8, plus the parental line. Report the euploid fraction. Discard or flag clones below ~70% 40,XY. High-G418 selection is a known aneuploidy risk and aneuploidy independently impairs differentiation.
9.3 Statistics
The original reports mean ± SD of three clones with no test anywhere. Specify in advance: the clone is the experimental unit (n = 3 per genotype, not the number of wells). Use a mixed model or a t-test on clone means; report exact p-values, effect sizes and CIs. With n = 3 per group, power is low — say so rather than implying significance from non-overlapping error bars.
9.4 Molecular characterization of Assay A
Apply the §8.2 marker panel to feeder-withdrawal differentiation. The original scored it by morphology alone, so the RA-independent claim rests on appearance only.
9.5 Contemporary additions worth considering
- Germline/chimera contribution of the null ES cells — the assay Yamanaka would later make central to iPS validation (2007).
- Embryoid body differentiation as a third, feeder- and RA-independent route.
- Directed differentiation toward the specific lineages reported absent (skeletal muscle, chondrocyte) — turns a negative histological finding into a quantitative one.
§10 Timeline and decision points
| Stage | Duration | Output | Skippable? |
|---|---|---|---|
| §2 Targeting | 6–8 wk | NAT1+/− ES clones | No |
| §3 Germline | 4–6 mo | NAT1+/− mice | Yes — only needed for §4 |
| §4 Embryos | 4–6 wk | gastrulation phenotype | Yes |
| §5 Homozygosing | 2 wk | NAT1−/− ES clones + Checkpoint B | No |
| §9.2 Karyotype | 1 wk | clone QC | No (if claiming causality) |
| §6 Differentiation | 2–3 wk | Assays A/B/C | No |
| §7 Teratoma | 4 wk | germ-layer histology | No — strongest readout |
| §8 Molecular | 2–3 wk | array, Northern/qPCR, reporters | No |
| §9.1 Rescue | 6–8 wk | causal demonstration | No (if claiming causality) |
Shortest path to the core result: §2 → §5 → §9.2 → §6 → §7. Roughly 3–4 months, no mouse breeding, and it yields the ES-cell differentiation phenotype plus the teratoma readout — the two lines of evidence that carry the conclusion.
§11 Provenance and limits of this reconstruction
- Every [P] value traces to the paper; locators are in the companion extraction document, which is the authority for what the paper actually says.
- Every [S] value is a period-standard substitution for something the paper omits. These are plausible reconstructions, not recovered facts, and where the authors' actual conditions differed, your results may differ. Report supplied parameters explicitly in any methods section derived from this document.
- Every [M] item is absent from the original by design of this reconstruction, added because the original's gaps (no rescue, no karyotype, no statistics) prevent a causal reading.
- The source PDF was a scanned, OCR'd copy. Primer sequences and all concentrations must be verified against a clean copy of record before ordering reagents or beginning bench work.
- This protocol has not been executed or validated by its author. It is a documentary reconstruction from a single published paper.
About these documents
These four documents are the technical evidence behind the Deep Dive essay Machine Traces of Discovery Paths #1 — The Path to iPS Discovery. They were generated on 2026-08-12 with Claude Science (Anthropic), working autonomously from public scientific databases and the source papers; every value is traceable to the primary data. They have not been peer-reviewed. When citing this work, please cite the source papers listed below as well as this Lab Notebook.
AI-assistance disclosure. Analysis and drafting were performed with Claude Science (Anthropic): corpus construction, author disambiguation, statistics, and figure generation were executed by the tool, and the outputs were verified and edited by the author. Per COPE and ICMJE guidance, AI tools do not meet authorship criteria and are not listed as authors.
References
A. Yamanaka's own work
(Hong, H. et al., 2009) Hong H, Takahashi K, Ichisaka T, Aoi T, Kanagawa O, Nakagawa M, et al. Suppression of induced pluripotent stem cell generation by the p53-p21 pathway. Nature. 2009;460(7259):1132-5. doi:10.1038/nature08235. PMID: 19668191.
(Maruyama, M. et al., 2005) Maruyama M, Ichisaka T, Nakagawa M, Yamanaka S. Differential roles for Sox15 and Sox2 in transcriptional control in mouse embryonic stem cells. J Biol Chem. 2005;280(26):24371-9. doi:10.1074/jbc.M501423200. PMID: 15863505.
(Mitsui, K. et al., 2003) Mitsui K, Tokuzawa Y, Itoh H, Segawa K, Murakami M, Takahashi K, et al. The homeoprotein Nanog is required for maintenance of pluripotency in mouse epiblast and ES cells. Cell. 2003;113(5):631-42. doi:10.1016/s0092-8674(03)00393-3. PMID: 12787504.
(Miura, K. et al., 1990) Miura K, Yukimura T, Yamashita Y, Shichino K, Shimmen T, Saito M, et al. Effects of endothelin on renal hemodynamics and renal function in anesthetized dogs. Am J Hypertens. 1990;3(8 Pt 1):632-4. doi:10.1093/ajh/3.8.632. PMID: 2222955.
(Nakagawa, M. et al., 2008) Nakagawa M, Koyanagi M, Tanabe K, Takahashi K, Ichisaka T, Aoi T, et al. Generation of induced pluripotent stem cells without Myc from mouse and human fibroblasts. Nat Biotechnol. 2008;26(1):101-6. doi:10.1038/nbt1374. PMID: 18059259.
(Okita, K. et al., 2007) Okita K, Ichisaka T, Yamanaka S. Generation of germline-competent induced pluripotent stem cells. Nature. 2007;448(7151):313-7. doi:10.1038/nature05934. PMID: 17554338.
(Okita, K. et al., 2008) Okita K, Nakagawa M, Hyenjong H, Ichisaka T, Yamanaka S. Generation of mouse induced pluripotent stem cells without viral vectors. Science. 2008;322(5903):949-53. doi:10.1126/science.1164270. PMID: 18845712.
(Takahashi, K. et al., 2003) Takahashi K, Mitsui K, Yamanaka S. Role of ERas in promoting tumour-like properties in mouse embryonic stem cells. Nature. 2003;423(6939):541-5. doi:10.1038/nature01646. PMID: 12774123.
(Takahashi, K. & Yamanaka, S., 2006) Takahashi K, Yamanaka S. Induction of pluripotent stem cells from mouse embryonic and adult fibroblast cultures by defined factors. Cell. 2006;126(4):663-76. doi:10.1016/j.cell.2006.07.024. PMID: 16904174.
(Takahashi, K. et al., 2007) Takahashi K, Tanabe K, Ohnuki M, Narita M, Ichisaka T, Tomoda K, et al. Induction of pluripotent stem cells from adult human fibroblasts by defined factors. Cell. 2007;131(5):861-72. doi:10.1016/j.cell.2007.11.019. PMID: 18035408.
(Tokuzawa, Y. et al., 2003) Tokuzawa Y, Kaiho E, Maruyama M, Takahashi K, Mitsui K, Maeda M, et al. Fbx15 is a novel target of Oct3/4 but is dispensable for embryonic stem cell self-renewal and mouse development. Mol Cell Biol. 2003;23(8):2699-708. doi:10.1128/MCB.23.8.2699-2708.2003. PMID: 12665572.
(Yamanaka, S. et al., 1992) Yamanaka S, Miura K, Yukimura T, Okumura M, Yamamoto K. Putative mechanism of hypotensive action of platelet-activating factor in dogs. Circ Res. 1992;70(5):893-901. doi:10.1161/01.res.70.5.893. PMID: 1568300.
(Yamanaka, S. et al., 1993) Yamanaka S, Miura K, Yukimura T, Yamamoto K. 11-Dehydro thromboxane B2: a reliable parameter of thromboxane A2 production in dogs. Prostaglandins. 1993;45(3):221-8. doi:10.1016/0090-6980(93)90048-c. PMID: 8484010.
(Yamanaka, S. et al., 1994) Yamanaka S, Poksay KS, Balestra ME, Zeng GQ, Innerarity TL. Cloning and mutagenesis of the rabbit ApoB mRNA editing protein. A zinc motif is essential for catalytic activity, and noncatalytic auxiliary factor(s) of the editing complex are widely distributed. J Biol Chem. 1994;269(34):21725-34. doi:10.1016/s0021-9258(17)31865-3. PMID: 8063816.
(Yamanaka, S. et al., 1995) Yamanaka S, Balestra ME, Ferrell LD, Fan J, Arnold KS, Taylor S, et al. Apolipoprotein B mRNA-editing protein induces hepatocellular carcinoma and dysplasia in transgenic animals. Proc Natl Acad Sci U S A. 1995;92(18):8483-7. doi:10.1073/pnas.92.18.8483. PMID: 7667315.
(Yamanaka, S. et al., 1996) Yamanaka S, Poksay KS, Driscoll DM, Innerarity TL. Hyperediting of multiple cytidines of apolipoprotein B mRNA by APOBEC-1 requires auxiliary protein(s) but not a mooring sequence motif. J Biol Chem. 1996;271(19):11506-10. doi:10.1074/jbc.271.19.11506. PMID: 8626710.
(Yamanaka, S. et al., 1997) Yamanaka S, Poksay KS, Arnold KS, Innerarity TL. A novel translational repressor mRNA is edited extensively in livers containing tumors caused by the transgene expression of the apoB mRNA-editing enzyme. Genes Dev. 1997;11(3):321-33. doi:10.1101/gad.11.3.321. PMID: 9030685.
(Yamanaka, S. et al., 2000) Yamanaka S, Zhang XY, Maeda M, Miura K, Wang S, Farese RV Jr, et al. Essential role of NAT1/p97/DAP5 in embryonic differentiation and the retinoic acid pathway. EMBO J. 2000;19(20):5533-41. doi:10.1093/emboj/19.20.5533. PMID: 11032820.
B. Prior work (most-cited, from reference-list analysis)
(Avilion, A. A. et al., 2003) Avilion AA, Nicolis SK, Pevny LH, Perez L, Vivian N, Lovell-Badge R. Multipotent cell lineages in early mouse development depend on SOX2 function. Genes Dev. 2003;17(1):126-40. doi:10.1101/gad.224503. PMID: 12514105.
(Chambers, I. et al., 2003) Chambers I, Colby D, Robertson M, Nichols J, Lee S, Tweedie S, et al. Functional expression cloning of Nanog, a pluripotency sustaining factor in embryonic stem cells. Cell. 2003;113(5):643-55. doi:10.1016/s0092-8674(03)00392-1. PMID: 12787505.
(Cowan, C. A. et al., 2005) Cowan CA, Atienza J, Melton DA, Eggan K. Nuclear reprogramming of somatic cells after fusion with human embryonic stem cells. Science. 2005;309(5739):1369-73. doi:10.1126/science.1116447. PMID: 16123299.
(Evans, M. J. & Kaufman, M. H., 1981) Evans MJ, Kaufman MH. Establishment in culture of pluripotential cells from mouse embryos. Nature. 1981;292(5819):154-6. doi:10.1038/292154a0. PMID: 7242681.
(Martin, G. R., 1981) Martin GR. Isolation of a pluripotent cell line from early mouse embryos cultured in medium conditioned by teratocarcinoma stem cells. Proc Natl Acad Sci U S A. 1981;78(12):7634-8. doi:10.1073/pnas.78.12.7634. PMID: 6950406.
(Morita, S. et al., 2000) Morita S, Kojima T, Kitamura T. Plat-E: an efficient and stable system for transient packaging of retroviruses. Gene Ther. 2000;7(12):1063-6. doi:10.1038/sj.gt.3301206. PMID: 10871756.
(Nichols, J. et al., 1998) Nichols J, Zevnik B, Anastassiadis K, Niwa H, Klewe-Nebenius D, Chambers I, et al. Formation of pluripotent stem cells in the mammalian embryo depends on the POU transcription factor Oct4. Cell. 1998;95(3):379-91. doi:10.1016/s0092-8674(00)81769-9. PMID: 9814708.
(Niwa, H. et al., 2000) Niwa H, Miyazaki J, Smith AG. Quantitative expression of Oct-3/4 defines differentiation, dedifferentiation or self-renewal of ES cells. Nat Genet. 2000;24(4):372-6. doi:10.1038/74199. PMID: 10742100.
(Thomson, J. A. et al., 1998) Thomson JA, Itskovitz-Eldor J, Shapiro SS, Waknitz MA, Swiergiel JJ, Marshall VS, et al. Embryonic stem cell lines derived from human blastocysts. Science. 1998;282(5391):1145-7. doi:10.1126/science.282.5391.1145. PMID: 9804556.
(Yuan, H. et al., 1995) Yuan H, Corbi N, Basilico C, Dailey L. Developmental-specific activity of the FGF-4 enhancer requires the synergistic action of Sox2 and Oct-3. Genes Dev. 1995;9(21):2635-45. doi:10.1101/gad.9.21.2635. PMID: 7590241.