Machine Traces of Discovery Paths #2 — Lab Notebook

Evidence for the Deep Dive essay Machine Traces of Discovery Paths #2 — The Path to iPS Discovery, A Comprehensive Analysis and Reconstruction.
This Lab Notebook is the verifiable source record behind the #2 Deep Dive. Where the essay states a claim, the support is here: the mechanism-level reconstruction of all nine papers (Evidence 1), the reagent-by-reagent connection between them (Evidence 2), the factor-selection process with its colony counts (Evidence 3), and the resolution comparison against #1 (Evidence 4). The reconstruction was read from the full text (Methods and Results) of the nine skeleton papers; abstracts were not used. Every experiment carries a verbatim quotation confirmed against the source, and every protocol value is tagged by provenance — [P] for a value printed in the paper, [S]/[M] for a value the paper omits and that must be supplied from period-standard practice.
Machine Traces of Discovery Paths #2 — Evidence 1 of 4 · Mechanism-level chain
Verifiable source document for the Deep Dive essay Machine Traces of Discovery Paths #2 — The Path to iPS Discovery, A Comprehensive Analysis and Reconstruction. This is the mechanism-level reconstruction of the nine-paper path, read from the full text (Methods and Results) of each paper. Each experiment carries a verbatim quotation confirmed against the source; each protocol value carries a provenance tag. This is a technical evidence document, not a process journal.
Mechanism-level reconstruction of the path — APOBEC-1 (1994) to iPS (2006)
A reconstruction based on the full text (Methods / Results) of the nine skeleton papers. Abstracts were not used.
Each hinge is described in the order: what experiment was done, what result it produced, and what it made possible next;
results carry the values printed in the paper, with a verbatim quotation as evidence.
Verification: the quoted words of all 70 extracted experiments are present in the source (word-match 1.00).
Of 818 numeric tokens in protocol_P, none disagree with the source (one only is flagged as a probable OCR-derived
typographic error, tagged [S⚠]). Every gene name in the 24-factor list is present in the 2006 body/SI.
The skeleton of the path
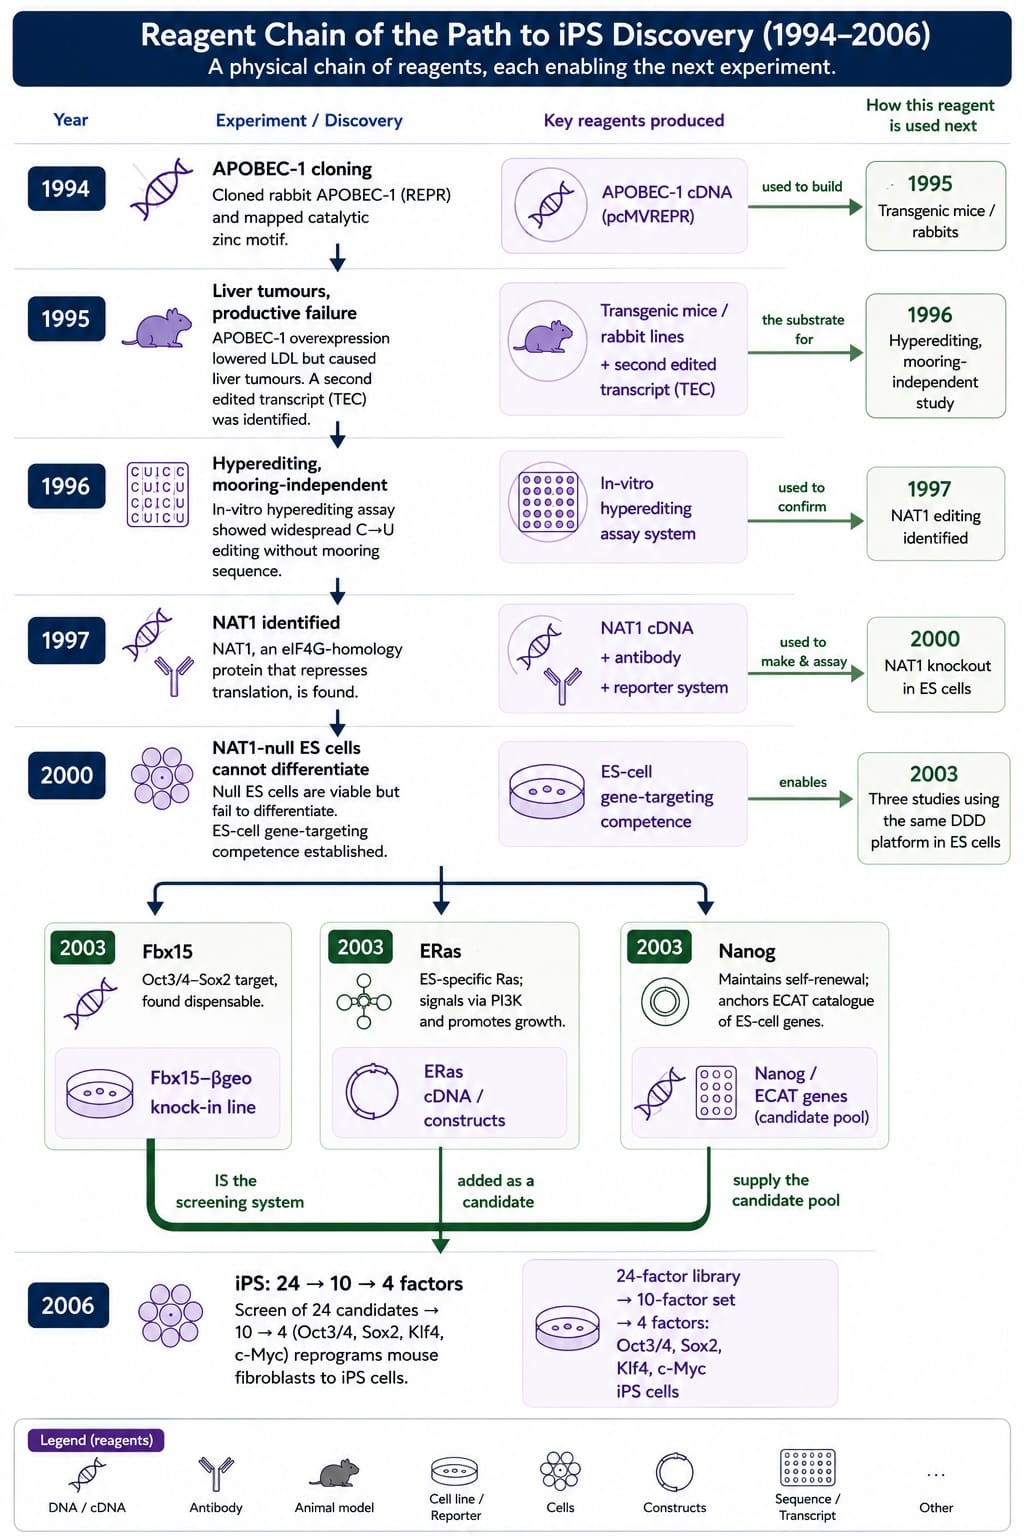
Reagent chain of the path to iPS discovery, 1994–2006
Each experiment produced a physical reagent (centre) used by a later experiment (right). The chain is not only of ideas but of materials: the 1994 cDNA builds the 1995 animals; the 1997 NAT1 cDNA and antibody make the 2000 knockout; and the Fbx15-βgeo knock-in line built in 2003 is the screening system of 2006.
H1 — Cloning of APOBEC-1 (REPR) and identification of the zinc motif
Yamanaka S, Poksay KS, Balestra ME, Zeng GQ, Innerarity TL. 1994 J Biol Chem 269(34):21725-34. PMID 8063816.
The question this paper set out to answer — To clone a full-length cDNA encoding the rabbit apoB mRNA editing protein (REPR), characterize its expression and tissue distribution, determine whether the noncatalytic auxiliary factor(s) required for apoB mRNA editing are similarly tissue-restricted, and use site-directed mutagenesis to test which conserved residues (putative zinc-coordinating His61, Cys93, Cys96, plus Glu63 and Pro92) are essential for catalytic (editing) activity.
Experiments and results
H1.1 Cloning of rabbit REPR cDNA
- What was done: RT-PCR of rabbit enterocyte poly(A)+ RNA with primers based on rat REPR sequence, sucrose gradient enrichment, cDNA library construction in pFrog vector, screening with a 32P-labeled oligonucleotide probe, and 5'/3' RACE PCR to obtain full-length clone (pREPR), followed by sequencing.
- What came out: A 284-bp RT-PCR product with 76% nucleotide identity to rat REPR was obtained; library screening of 2x10^5 clones yielded one 649-bp partial clone; RACE PCR completed the full-length 939-bp cDNA encoding a 236-amino acid protein (27,718 Da), 65% amino acid identity to rat REPR.
- Evidence: "The full-length nucleotide sequence is 939 bp, with an overall nucleotide sequence identity of 73% with rat REPR."
H1.2 Tissue distribution of REPR mRNA (Northern blot)
- What was done: Northern hybridization of total RNA (20 µg) from various rabbit tissues using 32P-labeled full-length REPR cDNA probe, with GAPDH as loading control.
- What came out: Hybridization signals of 1.8 and 1.1 kb were detected only in jejunum, ileum, duodenum, and colon; spleen, muscle, liver, kidney, heart, brain, and adrenals were negative.
- Evidence: "Hybridization signals of 1.8 and 1.1 kilobases were observed in the jejunum, ileum, duodenum, and colon. The spleen, muscle, liver, kidney, heart, brain, and adrenals were negative."
H1.3 Expression of REPR in three systems and editing activity
- What was done: Full-length REPR cDNA/cRNA expressed in Xenopus oocytes (microinjection), COS-7 cells (transient transfection), and in vitro transcription/translation (TNT reticulocyte lysate); resulting extracts/products tested for apoB RNA editing activity with or without chicken enterocyte S100 extract by in vitro assay and primer extension.
- What came out: REPR expressed in all three systems produced ~28-kDa protein but did not edit apoB RNA alone; editing activity appeared only when mixed with chicken enterocyte extract, which itself had no editing activity.
- Evidence: "In all three systems, REPR could not edit synthetic apoB RNA unless it was mixed with chicken enterocyte extract (100 pg). Note that the chicken enterocyte extract itself had no editing activity."
H1.4 Stoichiometric relationship between REPR and chicken enterocyte extract
- What was done: Increasing amounts of chicken enterocyte extract were added to fixed 5 or 10 µg COS-7 cell extract expressing REPR; editing measured by in vitro assay and primer extension.
- What came out: Increasing chicken enterocyte extract increased editing activity up to a maximum of 25% (5 µg COS-7 extract) and 40% (10 µg COS-7 extract); with unlimited REPR, 85% of substrate could be edited in 3 h.
- Evidence: "increasing concentrations of chicken enterocyte extract increased editing activity up to a maximum of 25 and 40%, respectively."
H1.5 Liver auxiliary factor complementation across species
- What was done: S100 liver extracts from rabbit, marmoset, mouse, rat, and human hepatoma HepG2 cells were tested alone or added to COS-7 extract expressing rabbit REPR, assayed by in vitro editing/primer extension.
- What came out: Extracts from all species' livers activated REPR editing; mouse and rat liver extracts had small endogenous editing activity enhanced by REPR, whereas rabbit, marmoset liver and HepG2 alone had no editing activity.
- Evidence: "Extracts from the livers of all these species were able to activate the editing process of REPR (Fig. 6)."
H1.6 Tissue distribution of auxiliary factor(s) in rabbit
- What was done: S100 extracts from numerous rabbit tissues (kidney, gallbladder, stomach, adrenals, thyroid, testes, spleen, lung, ovary, heart, pancreas, pituitary, brain, muscle, small intestine, colon) tested alone or with COS-7 extract expressing REPR by in vitro assay and primer extension.
- What came out: Only colon and small intestine had endogenous editing activity; kidney, gallbladder, stomach, adrenals, thyroid, testes, spleen, lung, and ovary acquired activity upon complementation with REPR (percent edited given for each); heart, pancreas, pituitary, brain, and muscle showed no activity.
- Evidence: "Extracts from kidney (34), gallbladder (17), stomach (26), adrenals (13), thyroid (6), testes (61, spleen (3), lung (7), and ovary (1) could complement REPR for editing activity."
H1.7 Cross-species conservation of auxiliary factor (chicken and frog)
- What was done: S100 extracts from chicken tissues (enterocyte, liver, kidney) and frog tissues (heart, stomach, spleen, kidney, brain, liver) tested alone or with COS-7 extract expressing rabbit REPR.
- What came out: Chicken enterocyte, liver, and kidney extracts activated editing when added to REPR (56%, 34%, 27% edited respectively); none of the frog tissue extracts had significant auxiliary factor activity.
- Evidence: "Extracts from enterocyte (561, liver (34), and kidney (27) could complement REPR for editing activity... none of the SlOO extracts from the frog (heart, stomach, spleen, kidney, brain, or liver) had significant auxiliary factor(s) activity."
H1.8 Site-directed mutagenesis of putative zinc-coordinating and catalytic residues
- What was done: Mutants H61A, H61C, V62A, E63A, P92A, C93A, C96A, and truncation N66 were generated by PCR-based site-directed mutagenesis, transcribed/translated in vitro with [35S]methionine, normalized by specific radioactivity (10,000 cpm; 5700 cpm for N66), and tested for editing activity with chicken enterocyte extract by in vitro assay and primer extension (mean ± S.D. of three experiments).
- What came out: Wild-type activity was set as reference; H61A, C96A, E63A, and N66 had 0% activity; H61C had 26.5±3.7%; C93A had 5.8±0.8%; V62A had 89% (as stated in text) and P92A had 18% of wild-type activity; H61C in COS-7 cells retained 80% of wild-type activity.
- Evidence: "The E63A and N66 mutants lacked activity, while the V62A and P92A retained 89 and 18% of wild-type activity, respectively (Table I)."
What it made possible next
Provided the full-length rabbit REPR cDNA clone (pREPR/pcMVREPR, GenBank U10695), expression constructs (COS-7, Xenopus oocyte, in vitro transcription/translation systems), a panel of site-directed mutants (H61A, H61C, V62A, E63A, P92A, C93A, C96A, N66) mapping the catalytic zinc-coordination motif, and evidence that noncatalytic auxiliary factor(s) are widely distributed across tissues/species (mammals and chickens) independent of REPR/apoB expression, enabling future studies of REPR structure-function, purification/identification of the auxiliary factor(s), and exploration of REPR's role in other RNA editing systems or transgenic liver-editing experiments.
Protocol extraction — [P] values printed in the paper
- [P] poly(A)+ RNA amount for RT-PCR = 0.2 µg
- [P] PCR buffer = 10 mM Tris-HCl pH 8.3, 50 mM KCl, 1.5 mM MgCl2, 0.2 mM each dNTP, 0.2 µg each primer, 0.001% gelatin, 2 units AmpliTaq DNA polymerase
- [P] PCR cycling = 35 cycles: 1 min 95°C, 1 min 57°C, 2 min 72°C; final extension 72°C for 15 min
- [P] cDNA library screening = 2x10^5 clones screened with 32P-labeled 72-mer oligonucleotide probe
- [P] Hybridization buffer = 6x SSC, 5x Denhardt's solution, 0.1% SDS, 100 µg/ml salmon sperm DNA, 1x10^6 cpm/ml probe, 42°C for 16 h
- [P] Wash conditions = 1x SSC, 0.1% SDS at 50°C
- [P] Northern blot total RNA = 20 µg per tissue, 1.5% glyoxal denaturing agarose gel
- [P] In vitro editing reaction = 10 ng synthetic apoB RNA (354 nt rabbit apoB), 12 units RNasin, 100 µl buffer D (20 mM Hepes pH 7.9, 125 mM KCl, 0.25 mM EDTA, 0.20 mM EGTA, 20% glycerol, 0.25 mM DTT), incubated 30°C for 3 h
- [P] Oocyte injection = 50-100 Xenopus oocytes injected with 20-100 ng cRNA, incubated 48 h at 18°C in modified Barth's solution with 5% FBS
- [P] COS-7 transfection = 32 µg pcMVREPR + 128 µl Lipofectamine in DME, 30 min at 23°C incubation, then 4 h at 37°C in 7% CO2, cells harvested after 48 h
- [P] COS-7 extract centrifugation = 53,000 rpm, 4°C, 19 min, TL 100.2 rotor
- [P] In vitro transcription/translation = 1 µg pcMVREPR, TNT coupled reticulocyte lysate system with [35S]methionine
- [P] SDS-PAGE for translation products = 12.5% gel
- [P] S100 tissue extract amount for auxiliary factor assays = 100 µg
- [P] COS-7 extract amount added for complementation = 10 µg (or 5 µg in stoichiometry experiment)
- [P] Mutant editing activity normalization = 10,000 cpm 35S-labeled protein (5700 cpm for N66 due to fewer methionines)
- [P] Zinc restoration dialysis = 20 mM HEPES buffer with 5 mM ZnCl2 for 48 h
- [P] GenBank accession number = U10695
- [P] Full-length REPR cDNA size = 939 bp; encoded protein = 236 amino acids, 27,718 Da
Gaps requiring [S]/[M] — items not stated in the paper
- [S] Exact composition/identity of the auxiliary factor(s) (not purified or sequenced in this paper)
- [S] Quantitative amino acid sequence percent identity source data or alignment methodology details beyond percentages stated
- [S] Statistical methods used to compute mean ± S.D. in Table I (e.g., how 'percentage editing' was calculated from primer extension gels)
- [S] Exact molar/mass concentrations of chicken enterocyte extract used in Fig. 5 titration (only µg amounts of protein extract given, not molarity)
- [S] Purification protocol or amount of rabbit REPR protein needed for atomic absorption spectroscopy to confirm zinc binding (explicitly stated as future work, not done)
- [S] Detailed composition of 'modified Barth's solution' used for oocyte incubation
- [S] Specific antibody or method (if any) used to confirm REPR protein expression level differences among mutants beyond SDS-PAGE band intensity
- [S] Full nucleotide sequence of the 3' UTR AU-rich region and precise experimental method for the AU-rich sequence removal experiment (data not shown)
H2 — The productive failure — a cholesterol experiment produces liver tumours
Yamanaka S, Balestra ME, Ferrell LD, Fan J, Arnold KS, Taylor S, Taylor JM, Innerarity TL. 1995 Proc Natl Acad Sci U S A 92(18):8483-7. PMID 7667315.
The question this paper set out to answer — To generate transgenic mice and rabbits expressing rabbit APOBEC-1 (the apo-B mRNA-editing enzyme catalytic subunit) in the liver to determine whether hepatic expression of this cytidine deaminase would lower LDL cholesterol concentrations, and to study other possible biological roles of apo-B mRNA editing.
Experiments and results
H2.1 Generation and expression of APOBEC-1 transgenics
- What was done: A full-length rabbit APOBEC-1 cDNA was subcloned from pREPR into pLiv11 (linearized with Mun I) to create pLivREPR; a Sal I-Spe I fragment was microinjected into fertilized oocytes of ICR mice and New Zealand White rabbits. Founders identified by Southern blot; transgene copy number estimated. Four mouse lines (I-20, I-22, I-28L, I-28H) established. Northern blot analysis performed on tissues.
- What came out: Four independent transgenic mouse lines with copy numbers of 7, 17, 3, and 10 respectively were established from three founders; two rabbit founders had 1 and 17 copies. High-level hepatic expression of APOBEC-1 mRNA was seen in all mouse lines by Northern blot, with trace amounts in kidney and heart.
- Evidence: "their transgene copy numbers were estimated to be 7, 17, 3, and 10, respectively"
H2.2 Editing of endogenous apo-B mRNA
- What was done: Primer-extension analysis of hepatic apo-B mRNA from transgenic and control mouse and rabbit livers, using RT-PCR products from liver total RNA.
- What came out: An average of 92% of apo-B mRNA was edited in the livers of all four transgenic mouse lines (n=26), versus 83% in nontransgenic mice (n=23); mutant transgene mice showed 82% (n=4), no increase over control. Rabbit apo-B mRNA from the transgenic founder (17 copies) was 78% edited vs no significant editing in control rabbit liver.
- Evidence: "An average of 92% of apo-B mRNA was edited in the livers of all four transgenic mouse lines (n = 26)."
H2.3 In vitro editing activity assay
- What was done: S100 liver extracts were prepared from five transgenic (I-20) and five age- and sex-matched control mice; 5, 25, or 100 μg of extract incubated with synthetic apo-B RNA substrate for 2 hr at 30°C and analyzed by primer extension.
- What came out: Liver extracts from wild-type APOBEC-1 transgenic mice were 15-fold more active in editing synthetic apo-B RNA substrate in vitro than extracts from control mice.
- Evidence: "Liver extracts from wild-type APOBEC-1 transgenic mice were 15-fold more active in editing a synthetic apo-B RNA substrate in vitro than liver extracts from age- and sex-matched control mice"
H2.4 Lipoprotein analysis
- What was done: Agarose gel electrophoresis (1% gel, Fat Red 7B stain) of plasma (2 μl) and SDS/PAGE of d<1.063 g/ml lipoprotein fractions isolated by ultracentrifugation from transgenic and control mice; FPLC (Superose 6 column) cholesterol distribution analysis for the single-copy transgenic rabbit vs control rabbits.
- What came out: β-migrating LDL was not detected in plasma of transgenic mice by agarose gel or SDS/PAGE (apo-B100 absent). The single-copy transgenic rabbit had plasma cholesterol 127 mg/dl vs 163 mg/dl (nontransgenic littermate) and 149±10 mg/dl (average of four nonlittermate controls), with decreased VLDL/IDL/LDL and increased HDL.
- Evidence: "cholesterol levels of the transgenic rabbit, a nontransgenic littermate, and the average of four nonlittermate control rabbits were 127 mg/dl, 163 mg/dl, and 149 ± 10 mg/dl, respectively"
H2.5 Histopathological analysis of liver
- What was done: Livers fixed in 4% formaldehyde, paraffin embedded, stained with hematoxylin/eosin or trichrome for collagen; histopathological diagnosis per Maronpot et al. criteria; comparison of transgenic wild-type, transgenic mutant, and control mouse lines, and the high-copy transgenic rabbit.
- What came out: All wild-type transgenic mouse lines developed dysplasia and many developed hepatocellular carcinoma (e.g., I-20: 20 dysplasia, 1 carcinoma of 21 mice; I-22: 3 dysplasia, 2 carcinoma of 5; I-28H: 1 dysplasia, 4 carcinoma of 5; I-28L: 1 normal, 2 dysplasia, 1 carcinoma of 4). Mutant transgenic (8 mice) and control (20 mice) livers were normal/minimal dysplasia only. One liver weighed 18 g (40% of body weight). The high-copy transgenic rabbit had enlarged liver (112 g vs 72 g littermate), weight ~50% of littermate (1160 g vs 2250 g), with dysplasia, fibrosis, and lipid droplets.
- Evidence: "The livers of the transgenic mice were at least twice as large and, in some cases, 10 times larger than those of their nontransgenic littermates. One liver weighed 18 g, which was 40% of the weight of the entire mouse."
H2.6 Search and testing of candidate mRNAs for aberrant editing
- What was done: GenBank searched via FASTA for sequences similar to the 11-nt apo-B mooring sequence. Candidate mRNAs (fatty acid synthase, P1 protein, protein-tyrosine kinase TEC, prostaglandin synthase/TIS10) amplified by RT-PCR from control and transgenic mouse livers and analyzed by primer extension for C->U editing.
- What came out: 23 rodent sequences had the exact mooring sequence (including fatty acid synthase and P1 protein with cytidine 4-6 nt upstream); >100 sequences had a 1-nt different motif (including TEC and prostaglandin synthase with cytidine 5 or 7 nt upstream). None of four mRNAs was edited in control mice. In transgenic mice, three transcripts (FAS, P1, TIS10) were not edited, but protein-tyrosine kinase TEC was edited, changing codon 411 from CUG to UUG (a silent Leu->Leu change).
- Evidence: "mouse protein-tyrosine kinase TEC was edited in transgenic mice (Fig. SB), providing a second example of C -> U editing of an mRNA."
H2.7 Test for DNA editing by overexpressed APOBEC-1
- What was done: In vitro test of C6666 editing in a 282-bp apo-B DNA fragment (positions 6504-6785); PCR and primer-extension analysis of genomic apo-B DNA (C6656 region) from transgenic mouse livers overexpressing APOBEC-1.
- What came out: C6666 in the 282-bp apo-B DNA fragment was not edited in vitro, and genomic C6656 was not edited in vivo in transgenic mouse liver DNA.
- Evidence: "C6666 in a 282-bp apo-B DNA fragment, 6504-6785, was not edited in vitro. Moreover, PCR and primer-extension analysis of genomic apo-B DNA from transgenic mouse livers overexpressing APOBEC-1 indicated that the genomic C6656 was not edited in vivo"
What it made possible next
Established that overexpression of APOBEC-1 cytidine deaminase in transgenic animal liver both lowers LDL/apo-B100 and causes liver dysplasia/hepatocellular carcinoma, identified a non-apo-B mRNA target (TEC tyrosine kinase) for aberrant C->U editing, provided the pLivREPR/pLiv11 hepatic expression vector and transgenic mouse/rabbit lines, and provided a mooring-sequence-based bioinformatic/primer-extension method for identifying candidate edited mRNAs for future work on APOBEC-1 substrate specificity and oncogenesis mechanisms, while flagging risks for APOBEC-1-based gene therapy approaches to lowering LDL.
Protocol extraction — [P] values printed in the paper
- [P] Restriction enzymes = EcoRI (excision from pREPR), Mun I (linearization of pLiv11), Sal I-Spe I (fragment for microinjection)
- [P] Vector = pLivII (pLiv11)
- [P] Source plasmid = pREPR
- [P] Resulting construct = pLivREPR
- [P] Mouse strain = ICR mice (Charles River Breeding Laboratories)
- [P] Rabbit strain = New Zealand White rabbits
- [P] Probe label = 32P-labeled rabbit APOBEC-1 cDNA probe
- [P] Total RNA amount (Northern blot) = 10 µg per lane
- [P] Total RNA amount (primer-extension cDNA synthesis) = 5-10 µg
- [P] DNase I treatment = 1 unit RNase-free DNase I, 37°C for 15 min
- [P] DNase I heat inactivation = 90°C for 10 min
- [P] PCR primers mouse apo-B = M49mouse (CTGATGCATCTGACTGGGAGAGACAAGTATCTG) and M50mouse (CGGATATGATACTGTTCATCAAGAA)
- [P] PCR primers rabbit apo-B = M49rabbit (CTGAGTACATTCAATTGGGAGAGACAAGTTTCCA) and M50rabbit (CGGATATGATAACGTTCATCAAGAA)
- [P] PCR primers fatty acid synthase = FASU (TCCGTGGACCTTATCACTAA) and FASL (CCATAGGTGCCGCCTGTCTT)
- [P] PCR primers P1 protein = P1U (CATTGCAAAGGCGGCATCC) and P1L (TGAAGAGCAGGTCAAATCTA)
- [P] PCR primers TEC = TECU (GGCCATTTCAGCAGAGACAT) and TECL (GCACACCAAACGACCAGACG)
- [P] PCR primers prostaglandin synthase = TISU (TGTCAAAACCGTGGGGAATG) and TISL (AGTGGGTCAGGATGTAGTGC)
- [P] Purification columns = MicroSpin S-300HR columns (Pharmacia)
- [P] Primer-extension product analyzed volume = 2 µl
- [P] S100 extracts prepared from = 5 transgenic mice (I-20) and 5 age- and sex-matched control mice
- [P] In vitro editing assay protein amounts = 5, 25, or 100 µg S100 liver extract
- [P] In vitro editing incubation = 2 hr at 30°C
- [P] Liver fixation = 4% formaldehyde
- [P] Histological stains = hematoxylin/eosin or trichrome stain for collagen
- [P] Agarose gel electrophoresis plasma volume = 2 µl plasma
- [P] Agarose gel concentration = 1% agarose gel
- [P] Lipoprotein stain = Fat Red 7B
- [P] Ultracentrifugation fraction isolated = d < 1.063 g/ml fraction from 1 ml mouse plasma
- [P] Dialysis buffer = 5 mM ammonium bicarbonate
- [P] SDS/PAGE gel = 5% SDS/PAGE
- [P] SDS/PAGE stain = Coomassie blue
- [P] Transgene copy numbers (mouse lines) = I-20 = 7, I-22 = 17, I-28L = 3, I-28H = 10
- [P] Rabbit transgene copy numbers = founder 1 = 1 copy, founder 2 = 17 copies
- [P] Mouse apo-B mRNA editing (wild-type transgenic) = 94% edited
- [P] Mouse apo-B mRNA editing (mutant transgenic) = 80% edited
- [P] Mouse apo-B mRNA editing (control) = 81% edited
- [P] Rabbit apo-B mRNA editing (transgenic founder, 17 copies) = 78% edited
- [P] Average editing in transgenic mouse lines = 92% (n=26)
- [P] Mutant transgenic mouse editing = 82% (n=4)
- [P] Nontransgenic mouse editing = 83% (n=23)
- [P] In vitro editing activity fold-increase = 15-fold more active in transgenic vs control liver extracts
- [P] Liver weight example = 18 g (40% of mouse body weight)
- [P] Transgenic rabbit euthanized at = 8 weeks
- [P] Transgenic rabbit weight vs littermate = 1160 g vs 2250 g (~50%)
- [P] Transgenic rabbit liver weight vs littermate = 112 g vs 72 g (~1.5x)
- [P] Apo-B48 proportion in high-copy transgenic rabbit lipoproteins = >50%
- [P] One transgenic mouse (I-28H) hepatic hyperplasia observed at = 24 days
- [P] Apo-B DNA fragment tested for editing = 282-bp fragment, nt 6504-6785
- [P] Genomic cytidine position tested = C6656
- [P] Apo-B mRNA edited cytidine position = nt 6666 (C6666)
- [P] Mooring sequence position = 5 nt downstream from C6666
- [P] GenBank search program = FASTA program
- [P] Number of rodent sequences with exact mooring sequence = 23
- [P] Number of sequences with 1-nt different motif = >100
- [P] Cytidine positions upstream of mooring sequence (FAS, P1) = 4-6 nt
- [P] Cytidine positions upstream (TEC, prostaglandin synthase) = 5 or 7 nt
- [P] TEC codon change = codon 411 CUG to UUG (Leu -> Leu, silent)
- [P] Rabbit ages at lipoprotein analysis (Fig. 6) = 2 months old
- [P] Plasma cholesterol levels (Fig. 6) = transgenic rabbit 127 mg/dl, nontransgenic littermate 163 mg/dl, average of 4 nonlittermate controls 149 ± 10 mg/dl
- [P] FPLC column = Superose 6 column (HR10/30)
- [P] Plasma volume for FPLC = 200 µl
- [P] Funding grants = NIH Program Project Grant HL47660; UC Tobacco-Related Disease Research Program Grant 3RT-0404
Gaps requiring [S]/[M] — items not stated in the paper
- [S] Composition of culture/injection media used for oocyte microinjection and embryo transfer
- [S] Exact microinjection procedure parameters (needle size, injection volume, pronuclear vs cytoplasmic injection)
- [S] Number of oocytes injected and pregnancy/live-birth rates
- [S] Scoring rubric/criteria details from Maronpot et al. beyond category names for histopathological grading
- [S] Statistical methods/tests used to compare editing percentages or lipoprotein levels between groups
- [S] Composition of S100 extract preparation buffer/method (only reference 21 cited, not detailed in text)
- [S] Antibody information (none given, though Coomassie/Fat Red are dyes not antibodies) - dilution or source of any antibodies used, if any employed elsewhere
- [S] Housing conditions, diet, and light cycle for mice and rabbits
- [S] Exact PCR cycling conditions (annealing temperature, number of cycles, extension times)
- [S] Definition of 'age- and sex-matched' control criteria (specific ages/sexes used)
- [S] Sample size (n) and selection criteria for histological analysis time points across mouse lines
- [S] Method/kit details for Southern blot hybridization and wash conditions
H3 — The mechanism of off-target hyperediting — independent of the mooring sequence
Yamanaka S, Poksay KS, Driscoll DM, Innerarity TL. 1996 J Biol Chem 271(19):11506-10. PMID 8626710.
The question this paper set out to answer — To determine whether cytidines other than the canonical C6666 in apoB mRNA are edited when APOBEC-1 is overexpressed in transgenic animal livers, and to use the pattern of this "hyperediting" to gain insight into the sequence requirements (specifically the role of the mooring sequence and auxiliary proteins) for apoB mRNA editing.
Experiments and results
H3.1 Sequencing of apoB mRNA from APOBEC-1 transgenic animals
- What was done: Total RNA from control and APOBEC-1 transgenic mouse and rabbit livers, and from mice expressing human apoB with or without rabbit APOBEC-1, was RT-PCR amplified around C6666, subcloned into pCRII vectors, and multiple clones sequenced to identify edited cytidines.
- What came out: In control animals only the canonical C6666 (and slight editing of C6806 in human transcript) was edited. In APOBEC-1 transgenic animals, hepatic apoB mRNAs of all three species (mouse, rabbit, human) were extensively edited at multiple sites, with two major clusters (C6738-C6762 and C6802-C6816) and one minor cluster (C6773-C6783); pattern appeared stochastic with no 5' to 3' preference.
- Evidence: "In the transgenic animals expressing rabbit APOBEC-1, the hepatic apoB mRNAs of all three species were extensively edited at multiple sites (Fig. 1)."
H3.2 Primer extension confirmation of hyperediting sites
- What was done: RT-PCR products of mouse apoB mRNA from control and transgenic livers were analyzed by primer extension using three primers (M52, M53, M54) to detect editing at specific cytidines.
- What came out: M52 showed C6743 and C6738 edited in transgenic but not control animals, with C6738 editing signal much stronger than C6743. M53 showed C6707, C6702, C6699/6700, and C6675 edited in transgenic but not control mice. M54 confirmed C6675 editing in transgenic but not control mice.
- Evidence: "The second primer (M53) verified that C6707,C6702, C6699/6700, and C6675 were edited in the transgenic mice but not in the nontransgenic mice."
H3.3 Nearest-neighbor nucleotide preference analysis
- What was done: Sequence context immediately flanking each of the 40 edited cytidines identified across the three apoB mRNAs was analyzed for base composition.
- What came out: The nucleotide immediately upstream of edited cytidines was thymidine in 70% and adenosine in 30% of cases; downstream nucleotide was adenosine in 58%, thymidine in 27%, cytidine in 10%, and guanosine in 5% of cases, indicating a preference for cytidines flanked by T or A.
- Evidence: "The nucleotide immediately upstream from the editing site was either thymidine (70%) or adenosine (30%). The nucleotide immediately downstream usually was adenosine (58%) or thymidine (27%) and, less frequently, cytidine (10%) or guanosine (5%)."
H3.4 Sequencing of other mooring-sequence-containing mRNAs in transgenic livers
- What was done: 250-300 bp fragments around mooring-like sequences of fatty acid synthase, P1 protein, and tyrosine kinase mRNAs were RT-PCR amplified from APOBEC-1 transgenic mouse livers, subcloned (10 subclones each), and sequenced.
- What came out: No cytidine at any position was edited in these mRNAs despite containing the exact or near-exact mooring sequence, contrasting with apoB mRNA.
- Evidence: "In contrast to apoB mRNA, no cytidine at any position was edited in these mRNAs (data not shown), suggesting that sequence and/or structure element(s) other than the mooring sequence are required for both normal and hyperediting."
H3.5 In vitro editing assay with mooring sequence mutants and liver extracts
- What was done: Synthetic 280-bp baboon apoB RNA (wild-type, mutant 118 with double mutation, mutant 124 with triple mutation in mooring sequence) was incubated at 30C for 16h with control mouse liver extract, APOBEC-1 transgenic mouse liver extract, MBP-APOBEC-1 fusion protein alone, or MBP-APOBEC-1 plus rabbit liver extract (auxiliary protein source); editing of C6666 and C6738/C6743 assessed by primer extension.
- What came out: Normal mouse liver extract edited 26+/-6% (n=5) of C6666 in wild-type but failed to edit mutants. Transgenic mouse liver extract edited 70+/-18% (n=5) wild-type C6666, reduced to 38+/-18% (mutant118) and 22+/-15% (mutant124). MBP-APOBEC-1 alone edited none. MBP-APOBEC-1 + rabbit liver extract edited 71+/-13% (wild-type), 33+/-7% (mutant118), 16+/-6% (mutant124) at C6666. For hyperediting sites C6738/C6743: control extract edited little; transgenic extract edited 4+/-2% (n=5) wild-type but MORE in mutant118 (11+/-8%) and mutant124 (11+/-6%); MBP-APOBEC-1+auxiliary protein edited 15+/-5% wild-type, 19+/-5% mutant118, 17+/-4% mutant124.
- Evidence: "Liver extract from a transgenic mouse overexpressing rabbit APOBEC-1 edited 70 6 18% (n 5 5) of C6666 from wild-type apoB RNA, which was reduced to 38 6 18% (n 5 5) and 22 6 15% (n 5 5) for RNA mutants 118 and 124, respectively."
H3.6 Editing of apoB RNA lacking the mooring sequence
- What was done: A shorter synthetic apoB RNA substrate (nt 6687-6824 of rabbit apoB mRNA) lacking the mooring sequence was incubated with recombinant MBP-APOBEC-1 and rabbit liver auxiliary protein(s) in vitro.
- What came out: 12.5% of C6802 in this mooring-sequence-lacking substrate was edited, demonstrating hyperediting occurs without the mooring sequence.
- Evidence: "When incubated with the recombinant MBPAPOBEC-1 and the auxiliary protein(s) in vitro, 12.5% of C6802 of this substrate RNA was edited (data not shown), demonstrating that hyperediting does not require the mooring sequence, at least for C6802."
H3.7 Second mooring sequence insertion experiment (mutant SR2)
- What was done: A second mooring sequence was introduced upstream at nt 6597 in baboon apoB RNA (mutant SR2). Wild-type and SR2 synthetic RNA were incubated with MBP-APOBEC-1 and rabbit liver extract in vitro; editing assessed by primer extension.
- What came out: Introduction of the second mooring sequence led to editing of C6597 immediately upstream, but downstream cytidines C6604, C6626, and C6639 were not edited in either wild-type or SR2 RNA, showing the second mooring sequence did not induce hyperediting.
- Evidence: "C6604,C6626, and C6639, which were downstream from the second mooring sequence, were not edited in either wild-type or SR2 RNA, showing that the introduction of the second mooring sequence did not lead to the hyperediting."
H3.8 Time-course of editing versus hyperediting
- What was done: Baboon synthetic apoB RNA was incubated with 5 micrograms MBP-APOBEC-1 and 100 micrograms rabbit liver extract containing auxiliary protein(s) for 2-16 hours; editing of C6666 and C6738/6743 determined by primer extension at each time point.
- What came out: Hyperediting of C6738/6743 was detected at 4% at 2h and gradually increased to 23% at 16h. In contrast, C6666 editing was 65% at 2h and 81% at 4h with no further increase after 4h, showing normal editing is faster and more efficient than hyperediting.
- Evidence: "The hyperediting of C6738/6743 was detected after 2 h (4%) and gradually increased up to 16 h (23%). In contrast, C6666 was edited 65% at 2 h and 81% at 4 h."
What it made possible next
The paper establishes an in vitro hyperediting assay system (synthetic apoB RNA substrates + liver extracts/recombinant MBP-APOBEC-1 + auxiliary protein source) and defines mooring-sequence-independent multi-site editing, providing a basis and reagents/constructs (mutant 118, mutant 124, SR2, mooring-sequence-lacking substrate nt 6687-6824) for future work to identify the unidentified auxiliary protein(s) and the sequence/structure element(s) required for the first, mooring-independent recognition step proposed in the two-step model.
Protocol extraction — [P] values printed in the paper
- [P] Incubation temperature = 30 °C
- [P] Incubation duration = 2-16 h
- [P] Synthetic RNA amount per reaction = 100 picograms
- [P] Control/transgenic mouse liver extract amount = 100 μg
- [P] MBP-APOBEC-1 fusion protein amount = 5 μg
- [P] Auxiliary protein source (rabbit liver extract) amount = 100 μg
- [P] Wild-type baboon apoB cDNA fragment length = 280 base pairs
- [P] Second synthetic RNA substrate = nt 6687-6824 of rabbit apoB mRNA
- [P] Mutant 118 mooring sequence = TGgTCACTtTA (double mutation)
- [P] Mutant 124 mooring sequence = gGATgAGaATA (triple mutation)
- [P] Wild-type mooring sequence = TGATCAGTATA
- [P] Mooring sequence nucleotide position = nt 6671-6681
- [P] Canonical editing site = C6666
- [P] Mutant SR2 = second mooring sequence introduced at nt 6597
- [P] RT-PCR amplified fragment size (Fig.1) = ~350 base pairs
- [P] PCR product fragment size for FAS/P1/tyrosine kinase = 250-300 base pairs
- [P] Number of subclones sequenced per mRNA (FAS, P1, tyrosine kinase) = 10
- [P] Number of clones sequenced: mouse apoB (n=25), rabbit apoB (n=18), human apoB (n=10)
- [P] Sequencing region examined = nt 6543-6851 (Fig.1) and nt 6504-6665 upstream region
- [P] AU content of amplified mouse apoB fragment = 69.7%
- [P] AU content of P1 protein mRNA = 47.7%
- [P] AU content of fatty acid synthase mRNA = 41.9%
- [P] AU content of N-myc 3'UTR = 68.5%
- [P] Primers for detection: M52, M53, M54 (mouse apoB), M51 and M51-124 and M52B (baboon apoB)
- [P] Vector for subcloning PCR products = pCRII (Invitrogen)
- [P] Plasmid isolation kit = QIAwell 8 (Qiagen)
- [P] Sequencer = ABI model 373A DNA sequencer with T7 and SP6 primers
- [P] RNA transcription kit = MEGAscript (Ambion)
- [P] Linearization enzyme = HindIII
- [P] Buffer for in vitro editing = buffer D (ref 13)
Gaps requiring [S]/[M] — items not stated in the paper
- [S] Exact composition/identity of the auxiliary protein(s) is not determined in this paper
- [S] Precise molar/volume amounts (mL) of extract or exact protein concentration units beyond mg/μg totals are not specified
- [S] Statistical test method used to compare percentages (e.g., t-test) is not stated
- [S] Exact sequences of the RT-PCR primers MBU1/MBL1/RBU1/RBL1/HBU1/HBL1 given, but exact PCR cycling conditions (annealing temp, cycle number) are not provided
- [S] Exact age, sex, or number of transgenic mice/rabbits used per experiment is not stated
- [S] Exact composition of buffer D (referenced elsewhere) is not detailed in this text
- [S] Method for quantifying percent editing (band intensity quantification method/instrument) not described
- [S] Whether human apoB transgenic mice used in double-transgenic cross were homozygous or hemizygous is not stated
H4 — Identification of NAT1 — the turn to a translational repressor
Yamanaka S, Poksay KS, Arnold KS, Innerarity TL. 1997 Genes Dev 11(3):321-33. PMID 9030685.
The question this paper set out to answer — Overexpression of the apoB mRNA-editing enzyme APOBEC-1 in transgenic mouse and rabbit livers causes hepatocellular dysplasia/carcinoma not attributable to vector elements, insertion effects, or apoB48 overproduction. The authors hypothesized this oncogenesis results from aberrant (edited) other mRNA(s) encoding proteins with important cellular functions, and set out to identify additional target mRNAs of overexpressed APOBEC-1 beyond apoB, using a modified differential display technique, in order to discover molecules important in regulating cell growth.
Experiments and results
H4.1 Candidate mooring-sequence mRNA search
- What was done: Searched genomic databases for mRNAs containing apoB mooring-sequence-like motifs with cytidines four to six nucleotides upstream; examined editing of six candidate mRNAs in APOBEC-1 transgenic mouse livers versus control livers.
- What came out: Only one of six candidates (a tyrosine kinase mRNA) showed detectable editing (~1%), which did not change the encoded amino acid; no cytidines in any of the six candidates were edited in control mouse livers.
- Evidence: "only one of these six candidates [a tyrosine kinase mRNA (Mano et al. 1990)] showed detectable editing (-1%), which did not change the encoded amino acid"
H4.2 Modified differential display identification of NAT1
- What was done: Used mooring primers (complementary to mooring sequence, 3-5 degenerate nucleotides, 3' adenosine) instead of oligo-dT primers for differential display PCR on control vs. transgenic mouse liver RNA (line 120, 7-month-old mice); eluted, subcloned, and sequenced differentially amplified bands; confirmed by PCR amplification of a 92-bp region from control/transgenic liver RNA and genomic DNA, and by primer extension.
- What came out: Two clones (3-13, 3-13') matched human ESTs but mouse sequences had thymidines where human ESTs had cytidines; PCR products from transgenic liver RNA (but not control RNA or genomic DNA) showed thymidines replacing cytidines, confirming editing; primer extension confirmed multiple edited cytidines in transgenic mouse and rabbit livers. This mRNA was designated NAT1.
- Evidence: "the PCR products from the APOBEC-1 transgenic mouse liver RNA had thymidines in the place of several cytidines, as in the DNA from differential display"
H4.3 NAT1 tissue expression and conservation
- What was done: Northern blot analysis of NAT1 across human tissues, fetal tissues, and cell lines; Southern blot (EcoRI-digested) across species under high-stringency conditions.
- What came out: NAT1 is expressed at high levels in adult human heart, brain, placenta, lung, liver, skeletal muscle, kidney, pancreas, plus spleen, thymus, prostate, testis, ovary, small intestine, colon, and leukocytes; expressed in fetal brain, lung, liver, kidney; similar levels across 8 human cell lines tested; highly conserved among human, monkey, rat, mouse, dog, bovine, rabbit, with a weaker band in chicken and no band in yeast.
- Evidence: "NATl is expressed at high levels in adult human heart, brain, placenta, lung, liver, skeletal muscle, kidney, and pancreas"
H4.4 Full-length cDNA cloning and translation initiation mapping
- What was done: Obtained full-length human NAT1 cDNA (3.8 kb) via 5'-RACE-PCR; obtained mouse and rabbit full-length cDNAs by RT-PCR; performed in vitro transcription/translation of 5'-truncation mutants (Δ199, Δ241, Δ283, Δ302, Δ324) and substitution mutants (GTG307→GAG, ATT319→TTT) with [35S]methionine and SDS-PAGE.
- What came out: Northern blot showed a 4-kb transcript, confirming the 2.4-kb EST was not full length. First ATG at nt 925 predicted an 80-kD protein, but a 100-kD protein was observed instead. Truncation mapping localized the start codon to nucleotides 303-324; GTG→GAG mutant produced no significant protein, while ATT→TTT mutant still produced a 100-kD protein, identifying GTG at nucleotide 307 as the initiation codon, giving a 906-amino-acid, 102-kD calculated protein.
- Evidence: "These data demonstrate that the GTG codon at nucleotide 307 is the translation initiation codon of NATl."
H4.5 Hyperediting frequency and consequence mapping
- What was done: Sequenced multiple cDNA clones (7-23 clones per position) of full-length NAT1 from control and transgenic mouse liver RNA; also expressed multiple cDNA clones from control and transgenic livers by in vitro transcription/translation with [35S]methionine; Western blot of liver S100 extracts using anti-NAT1 polyclonal antibody (raised against amino acids 369-490).
- What came out: More than 100 cytidines throughout NAT1 were edited in transgenic mouse livers, with hyperediting frequency ranging from 4% (1/23 clones) to 71% (5/7 clones); cytidines in the 3' half (mooring-like sequence cluster) preferentially edited. All four control-derived clones produced 100-kD protein; four of five transgenic-derived clones produced truncated proteins of various sizes. Western blot showed markedly reduced NAT1 protein in transgenic livers despite similar mRNA levels between control and transgenic livers.
- Evidence: "more than 100 cytidines throughout the entire sequence of NATl were edited in transgenic mouse livers"
H4.6 In vitro editing requires auxiliary proteins
- What was done: Synthesized full-length NAT1 RNA by in vitro transcription and incubated with recombinant APOBEC-1 alone or with rabbit liver extracts (auxiliary proteins, no APOBEC-1); assessed editing by primer extension.
- What came out: Hyperediting of NAT1 occurred only in the presence of auxiliary proteins, not with recombinant APOBEC-1 alone.
- Evidence: "Primer extension analyses demonstrated hyperediting of NATl only in the presence of the auxiliary proteins"
H4.7 Yeast two-hybrid interaction with eIF4A/eIF4E
- What was done: Subcloned NAT1 into pGBT9 (GAL4 DNA-binding domain fusion) and eIF4A or eIF4E into pGAD424 (GAL4 activation domain fusion); cotransformed into yeast SFY526 containing lacZ reporter; assayed β-galactosidase activity.
- What came out: lacZ was activated in yeast cotransformed with NAT1 and eIF4A but not with NAT1 and control vector or NAT1 and eIF4E, indicating NAT1 binds eIF4A but not eIF4E.
- Evidence: "In the yeast cotransformed with NATl and eIF4A, lacZ was activated"
H4.8 Bicistronic reporter translation assay in COS7 cells
- What was done: Transiently cotransfected COS7 cells with a bicistronic CAT-IRES-luciferase reporter (0.5 µg) plus 1.5 µg of control vector (pcDNA3.1), carboxy-terminal eIF4G fragment (amino acids 477-1396, pFlag-4G(C)), or human NAT1 (pcDNA-hNAT1); measured CAT activity, luciferase activity, and reporter mRNA levels 72 hours post-transfection.
- What came out: The eIF4G carboxy-terminal fragment markedly enhanced cap-independent (luciferase) translation, confirming prior literature; NAT1 instead inhibited cap-independent translation of luciferase by 45%. Both the eIF4G fragment and NAT1 inhibited cap-dependent translation (CAT) by 40%.
- Evidence: "NATl inhibited the cap-independent translation of luciferase by 45%. Both the carboxyterminal portion of eIF4G and NATl inhibited the capdependent translation of CAT by 40%"
What it made possible next
The paper produced full-length cloned NAT1 cDNAs (human, mouse, rabbit; GenBank U76111-U76113), an anti-NAT1 polyclonal antibody, a mapped translation initiation codon, a bicistronic CAT-IRES-luciferase reporter system, yeast two-hybrid constructs (pGBT9-NAT1, pGAD424-4A, pGAD424-4E), mammalian expression vectors (pcDNA-hNAT1, pFlag-4G(C)), chromosomal localization (11p15), and an established modified differential display protocol using mooring primers — all of which enable later projects to test NAT1's role in cell growth/oncogenesis regulation, study its interactions with translation initiation factors, or search for further APOBEC-1 hyperediting targets in other tissues/species.
Protocol extraction — [P] values printed in the paper
- [P] mouse age for RNA isolation = 7-month-old
- [P] transgenic mouse line = line 120
- [P] RNA extraction reagent = Trizol reagent (Life Technologies)
- [P] number of arbitrary primers used = 24 different arbitrary 10-mer primers
- [P] number of mooring primers used = 3 different mooring primers
- [P] mooring primer composition = 3-5 degenerate nucleotides + adenosine at 3' end
- [P] PCR product labeling isotope = 32P
- [P] cloning vector for differential display products = pCRII vector (Invitrogen)
- [P] Northern/Southern blot wash conditions = 0.1x SSC, 0.1% SDS at 65°C
- [P] Northern blot exposure = -70°C with two intensifying screens for 2-6 hr
- [P] Southern blot exposure = -70°C with two intensifying screens for 15 hr
- [P] human EST clone size = 2.4 kb
- [P] full-length human NAT1 cDNA size = 3.8 kb
- [P] NAT1 transcript size (Northern blot) = 4-kb
- [P] nucleotide identity human vs mouse NAT1 = 95.5%
- [P] nucleotide identity rabbit vs mouse NAT1 = 94.8%
- [P] amino acid identity among mouse, human, rabbit NAT1 = 98.2%
- [P] 5' UTR length = 306 bases
- [P] 3' UTR length = 757 bases
- [P] 3' UTR AU content = 65.6%
- [P] 5' UTR conservation among species = 90.1%
- [P] 3' UTR conservation among species = 95.5%
- [P] translation initiation codon = GTG at nucleotide 307
- [P] open reading frame length = 2718 bases
- [P] encoded protein length = 906 amino acids
- [P] calculated molecular mass of NAT1 protein = 102 kD
- [P] observed molecular mass on SDS-PAGE = 100 kD
- [P] hyperediting frequency range = 4% (1/23 clones) to 71% (5/7 clones)
- [P] number of cDNA clones sequenced per position = 7 to 23 clones
- [P] number of cytidines edited in NAT1 = >100 cytidines
- [P] antibody immunogen = NAT1 amino acids 369-490
- [P] primary antibody dilution = 1:5000-10000
- [P] secondary antibody dilution = 1:10000
- [P] liver extract amount for Western blot = 50-100 µg
- [P] picornavirus protease cleavage site in eIF4G = amino acid 478
- [P] carboxy-terminal eIF4G fragment used = amino acids 477-1396
- [P] COS7 cell seeding = 1 x 10^5 cells per six-well plate, 24 hr before transfection
- [P] bicistronic reporter plasmid amount = 0.5 µg pCAT-IRES-Luc
- [P] co-transfected plasmid amount = 1.5 µg each (pcDNA3.1, pFlag-4G(C), or pcDNA-hNAT1)
- [P] transfection reagent ratio = 2 µl TransIT-LT2 per 1 µg DNA
- [P] DNA-liposome incubation time = 4 hr in serum-free medium
- [P] time to reporter assay after transfection = 72 hours
- [P] number of experiments averaged = six experiments for NAT1, two for eIF4G(C)
- [P] cap-independent translation inhibition by NAT1 = 45%
- [P] cap-dependent translation inhibition by NAT1 and eIF4G(C) = 40%
- [P] E. coli strain for recombinant protein = BL21
- [P] NAT1 fragment cloned into pQE30 = BamHI-HindIII fragment (380 bp)
- [P] human NAT1 chromosomal location = 11p15
- [P] NAT1 gene position on chromosome 11p = 68% of distance from centromere to telomere
- [P] metaphase cells analyzed = 80, with 74 showing specific labeling
- [P] hybridization solution composition = 50% formamide, 10% dextran sulfate, 2x SSC
- [P] GenBank accession numbers = U76111 (human), U76112 (mouse), U76113 (rabbit)
- [P] grant support = NIH grant HL47660
- [P] onset of hepatocellular carcinoma in transgenic mice = as early as 21 days after birth
- [P] PCR product size confirmed for editing = 92-bp sequence
- [P] PCR fragment size for primer extension assay = 115-base fragment
- [P] amino acid identity NAT1 with eIF4G homologs = 20-69%
Gaps requiring [S]/[M] — items not stated in the paper
- [S] Composition of culture medium (beyond DMEM + 10% FBS) and CO2 incubator conditions details for other cell lines
- [S] Seeding density/protocol for yeast two-hybrid transformation and beta-galactosidase assay conditions (time, substrate concentration)
- [S] Exact composition and volume of PCR reaction mixes and thermal cycling parameters (annealing temp, cycle number) for all PCR steps
- [S] Statistical methods used to determine significance of translation inhibition percentages (e.g., no error bars, p-values, or SD/SEM reported)
- [S] Scoring/quantification method for autoradiograph band intensity (densitometry method) used to calculate hyperediting frequency
- [S] Composition of in vitro transcription/translation reaction (TNT reticulocyte lysate) beyond kit name, e.g., RNA amount, methionine concentration
- [S] Details of nickel resin purification protocol (buffer compositions, imidazole concentrations) for His-tagged NAT1 protein
- [S] Rabbit immunization protocol details (adjuvant, dose, boost schedule, bleed schedule) for anti-NAT1 antibody production
- [S] Composition of extracts used for in vitro editing assay (protein concentration of rabbit liver extract, APOBEC-1 amount used)
- [S] Details of luciferase assay kit and CAT ELISA protocol steps (e.g., substrate volumes, read times)
- [S] Full recipe/composition of media used for bacterial transformation, induction conditions (IPTG concentration, induction time/temperature) for BL21 expression
- [S] Method and criteria for selecting/counting the 10 different chromosome 11 examples for FISH mapping measurement
- [S] Composition of RNA sample buffer or loading conditions for Northern/Southern gels
- [S] Age/sex of rabbits used for antibody production and this rabbit's housing/husbandry conditions
H5 — The NAT1 knockout — ES cells that cannot differentiate
Yamanaka S, Zhang XY, Maeda M, Miura K, Wang S, Farese RV Jr, Iwao H, Innerarity TL. 2000 EMBO J 19(20):5533-41. PMID 11032820.
The question this paper set out to answer — The paper set out to determine the in vivo function of NAT1/p97/DAP5 (an eIF4G homolog previously implicated in vitro as a global translation repressor that suppresses cellular proliferation) by disrupting its gene in mice, to test the hypothesis that NAT1 suppresses cellular proliferation and tumorigenesis by inhibiting eIF4E/eIF4G function.
Experiments and results
H5.1 Targeted disruption of NAT1 in ES cells / germline transmission
- What was done: A targeting vector replacing NAT1 exon 2 with a neo gene (pgk-tk for negative selection) was electroporated into RF8 ES cells, selected with G418 and FIAU; correctly targeted clones identified by Southern blot (EcoRI digestion) and PCR, and used to generate chimeric mice bred to C57BL/6 females; hepatic NAT1 mRNA measured by Northern blot in heterozygotes.
- What came out: Southern blot showed 4.4 kb band (wild-type) and 1.8 kb band (targeted locus); PCR gave 1.6 kb (wild-type) and 2.0 kb (targeted) fragments. Male chimeras transmitted the mutation through the germline. Northern blot showed 50% lower NAT1 mRNA in NAT1+/- mice than wild-type littermates; heterozygotes showed no detectable phenotypic changes including tumor incidence.
- Evidence: "Northern blot analysis of hepatic total RNA demonstrated 50% lower NATI mRNA levels in NATJ+I- mice than in wild-type littermates"
H5.2 NAT1-/- embryo phenotype
- What was done: NAT1+/- mice were intercrossed and offspring genotyped by PCR; embryos at E7.5-E11.5 examined histologically.
- What came out: No homozygous mice obtained from >20 heterozygous intercrosses. ~20% of embryos between E7.5-E10.5 were poorly developed and genotyped NAT1-/-. At E11.5 NAT1-/- embryos were absent and 16.7% of deciduae (3/18) were undergoing resorption. 20.5% of E7.5 embryos (7/34) lacked organized three primary germ layers; trophectoderm and primitive endoderm developed but mesoderm did not emerge from the epiblast.
- Evidence: "we did not obtain any homozygous mice from >20 heterozygous intercrosses...~ 20% of the embryos between embryonic day (E)7.5 and El0.5 were poorly developed"
H5.3 Generation and characterization of NAT1-/- ES cells (morphology, proliferation)
- What was done: NAT1-/- ES cell clones were generated from NAT1+/- cells by selection with high concentrations of G418; genotype confirmed by PCR/Southern/Northern; cells cultured on STO feeder cells; 10,000 cells of three NAT1+/- and three NAT1-/- clones were monitored daily for 5 days with a Coulter counter.
- What came out: Of 64 surviving colonies, 29 were NAT1-/- by PCR and Southern blot; Northern blot showed absent NAT1 mRNA in NAT1-/- ES cells. NAT1-/- cells were morphologically indistinguishable from wild-type/NAT1+/- cells on STO cells and proliferated normally.
- Evidence: "Of the 64 colonies that survived the selection, 29 were NATJ-1- by PCR (Figure 3A) and Southern blot analyses"
H5.4 Total protein synthesis and IRES translation assays
- What was done: Total protein synthesis measured by [35S]methionine/[35S]cysteine incorporation in three NAT1+/- and three NAT1-/- clones. Bicistronic reporter constructs (ptk-DLuc-EMCV, ptk-DLuc-myc, ptk-DLuc-NAT1) with RLuc (cap-dependent) and FLuc (IRES-dependent) were transfected into three NAT1+/- and three NAT1-/- clones; FLuc/RLuc measured 24h later.
- What came out: NAT1+/- and NAT1-/- ES cells showed similar amounts of radioactive amino acid incorporation into protein. IRES activities (EMCV, c-myc, NAT1) were indistinguishable between NAT1+/- and NAT1-/- cells; c-myc IRES was the most potent initiator.
- Evidence: "Both NATJ +I- and NATJ-1- ES cells showed similar amounts of incorporation of radioactive amino acids into proteins, suggesting that NATI is not involved in the regulation of general protein synthesis"
H5.5 Impaired differentiation upon feeder removal and RA treatment
- What was done: ES cells cultured without STO feeder cells with LIF, and treated with all-trans retinoic acid (RA, 3x10^-7 M) for 4 days in three NAT1+/- and three NAT1-/- clones. Proliferation measured after 5 days (10,000 cells seeded) with/without RA.
- What came out: 29/64 G418-resistant clones without feeders remained small and tightly associated and were all genotyped NAT1-/-. RA-treated NAT1+/- cells spread out, enlarged, and proliferation slowed markedly; RA-treated NAT1-/- cells remained small and highly associated with much smaller growth-suppressive effect of RA.
- Evidence: "The growth suppressive effect of RA was much smaller in NATJ-1- cells than in NATJ +l-cells"
H5.6 Teratoma formation in nude mice
- What was done: NAT1+/- and NAT1-/- ES cells (2x10^6 cells, three NAT1+/- and four NAT1-/- clones) injected subcutaneously into hind flanks of nude mice; after 3 weeks tumors dissected, weighed, and examined histologically.
- What came out: Tumors of similar weight formed (0.71 ± 0.42 g for NAT1+/- vs 0.54 ± 0.35 g for NAT1-/-). Teratomas from NAT1+/- cells contained well-differentiated tissues of all three germ layers (columnar epithelium, neural tissue, squamous epithelium, striated muscle, cartilage, bone). NAT1-/- teratomas were composed mainly of undifferentiated cells and neuroectoderm with rosette-like formations; no striated muscle or cartilage observed in any of 14 tumors from four independent NAT1-/- clones.
- Evidence: "no striated muscle or cartilage tissues were observed in any of 14 tumors derived from four independent NATJ-1- ES cell clones"
H5.7 Gene expression profiling and Northern blot of RA-responsive genes
- What was done: cDNA arrays of 588 genes compared expression profiles of NAT1+/- and NAT1-/- ES cells undifferentiated and after RA treatment for 5 days (RNA from three clones pooled per group). Northern blot analysis quantified nine genes (IGF-2, keratin 19, tPA, cyclin D2, collagen IV, PNl, c-jun, p21WAF1, cathepsin D) and two genes (Oct3/4, Sox2) in three clones per genotype.
- What came out: Undifferentiated NAT1+/- and NAT1-/- profiles were similar. RA induced >3-fold change in 19 genes in NAT1+/- cells; none of 588 genes changed >3-fold in NAT1-/- cells with RA. By Northern blot, nine genes were induced and two (Oct3/4, Sox2) reduced >3-fold by RA in NAT1+/- cells; in NAT1-/- cells basal and RA-induced expression of IGF-2 and PN1 were impaired, and RA-induced expression of keratin 19, tPA, cyclin D2, c-jun, p21WAF1 and cathepsin D was impaired despite normal basal levels; collagen IV and pax6 induction were normal.
- Evidence: "The expression of 19 genes increased >3-fold after the RA treatment...None of the 588 genes was induced or suppressed >3-fold in the absence of NATL"
H5.8 Transactivation assay with RA-responsive reporter elements
- What was done: Reporter genes containing two copies of DR2 or one copy of DR5 RA-response elements linked to minimal tk promoter and FLuc, plus control reporters (tk, SV40, pgk, pol II promoters), co-transfected with pRL-TK into three NAT1+/- and three NAT1-/- ES cell clones; cells maintained on STO or treated with RA (1x10^-6 M) for 24h; FLuc/RLuc measured.
- What came out: In NAT1+/- cells, RA stimulated expression of both DR2 and DR5 constructs >10-fold. In NAT1-/- cells, both basal and RA-induced expression of these constructs was significantly lower than in NAT1+/- cells. Control reporter genes (tk, SV40, pgk, pol II) showed similar FLuc/RLuc values in both genotypes.
- Evidence: "In NATI +I- cells, RA stimulated the expression of both DR2 and DR5 constructs >10-fold (Figure 8B). In NATI-I- cells, both the basal and RA-induced expression of these constructs was significantly lower"
What it made possible next
The paper produced NAT1+/- and NAT1-/- ES cell lines and a NAT1 knockout mouse model, plus validated tools (targeting vector pRTV-NAT1, PCR/Southern genotyping primers, bicistronic IRES reporter constructs, DR2/DR5 RA-responsive reporter constructs) that later projects could use to study NAT1's role in RA-dependent transcription complexes, tumor suppression (e.g., liver-specific knockout), or the mechanism by which a translation factor homolog controls specific transcriptional pathways.
Protocol extraction — [P] values printed in the paper
- [P] ES cell line = RF8
- [P] Targeting vector = pRTV-NAT1
- [P] Linearization enzyme = SalI
- [P] 5' homologous region PCR fragment = 1.2 kb (intron 1)
- [P] 3' homologous region PCR fragment = 5 kb (intron 2 to exon 18)
- [P] Southern blot probe size = 800 bp (exon 1)
- [P] Southern probe label = [32P]dCTP
- [P] Restriction enzyme for Southern = EcoRI
- [P] Agarose gel concentration = 0.8%
- [P] Wild-type EcoRI band = 4.4 kb
- [P] Targeted EcoRI band = 1.8 kb
- [P] PCR primer S-U1 = CTTCCTCCCCCTTCCCTCCCCCTTTT
- [P] PCR primer L39 = TTTGTGTAGCCCTGCCTGTCCTG
- [P] PCR primer S-L1 = CCTGCGTGCAATCCATCTTGTTCAAT
- [P] PCR wild-type band (targeting screen) = 1.6 kb
- [P] PCR targeted band (targeting screen) = 2 kb
- [P] PCR system = Expand Long Template PCR system (Boehringer Mannheim)
- [P] DMSO addition to PCR = 4%
- [P] Genotyping primer S-U4 = CTGCAGTGCTGGGAGCGGAAATAAAT
- [P] Genotyping primer S-U (antisense) = TTTGGCGGCTTGACAACGAAGAATCT
- [P] Genotyping wild-type band = 175 bp
- [P] Genotyping targeted band = 0.7 kb
- [P] NAT1+/- ES cell seeding for selection = 1 x 10^6 cells per 100 mm dish
- [P] G418 concentration for ES cell selection = 1.5 mg/ml
- [P] Selection duration = 8 days
- [P] Colonies surviving selection = 64
- [P] NAT1-/- colonies identified = 29
- [P] ES cells per well for protein synthesis assay = 1 x 10^4 cells per well (24-well plates)
- [P] Culture duration before labeling = 5 days
- [P] Starvation period (Met/Cys-free medium) = 30 min
- [P] [35S]methionine and [35S]cysteine final concentration = 0.14 mCi/ml
- [P] Labeling incubation time = 3 h
- [P] Trypsin solution volume/concentration = 100 µl of 2.5% trypsin
- [P] BSA/NaN3 solution = 400 µl of 0.1 mg/ml BSA with 0.02% NaN3
- [P] TCA addition = 400 µl of 20% trichloroacetic acid
- [P] TCA incubation on ice = 1 h
- [P] Filter wash = 10% trichloroacetic acid for 30 min, then 100% ethanol for 30 min
- [P] RA concentration (differentiation assay Figure 5) = 3 x 10^-7 M
- [P] RA treatment duration (Figure 5) = 4 days
- [P] LIF concentration = 1000 U/ml [S⚠] — the scan prints 'LIF, I 000 U/µ1'; "µl" would give an implausible concentration (1 U/nl), so it is read as an OCR corruption of "ml". Verify against a clean copy of record.
- [P] RA concentration (transactivation assay Figure 8) = 1 x 10^-6 M
- [P] Plasmid DNA amount transfected (IRES/transactivation assays) = 10 µg each
- [P] pRL-TK plasmid amount = 0.3 µg
- [P] ES cells electroporated = ~1 x 10^7 cells
- [P] Post-transfection incubation before luciferase assay = 24 h
- [P] Teratoma injection cell number = 2 x 10^6 cells
- [P] Teratoma formation duration = 3 weeks
- [P] Teratoma weight NAT1+/- = 0.71 ± 0.42 g
- [P] Teratoma weight NAT1-/- = 0.54 ± 0.35 g
- [P] cDNA array = Atlas mouse cDNA arrays (Clontech), 588 genes
- [P] Phosphoimager = Fuji BAS2500
- [P] Scintillation counter = MicroBeta (Wallac)
- [P] Filter type = FilterMat A (Wallac)
- [P] Solid scintillator = MeltiLex (Wallac)
- [P] NAT1-IRES-S primer = CGGAATTCAGCAGTGAGTCGGAGCTCTATG
- [P] NAT1-IRES-AS primer = ACTCTCCATGGTGGCGGCTTGACAACGAAG
- [P] MYC-U2320 primer = GGCTGAGGACCCCCGAGCTGTGCT
- [P] MYC-U500 primer = GGGCCATGGTCGCGGGAGGCTGCTGGAG
- [P] Cell number, proliferation/translation assay = 1 x 10^4 cells per well of 24-well plate [source prints '1 X 10⁴ cells per well']
- [P] Proliferation measurement duration = 5 days
- [P] Heterozygous intercrosses performed = >20
- [P] Embryos malformed at E7.5-E10.5 = ~20%
- [P] Deciduae undergoing resorption at E11.5 = 16.7% (3/18)
- [P] E7.5 embryos without organized germ layers = 20.5% (7/34)
Gaps requiring [S]/[M] — items not stated in the paper
- [S] Composition of ES cell culture medium (base medium, serum %, supplements)
- [S] STO feeder cell preparation/seeding density and mitotic inactivation method
- [S] Statistical tests used for significance (e.g., proliferation, gene expression comparisons)
- [S] Number of technical/biological replicates for each specific figure beyond 'three clones'
- [S] Electroporation voltage/capacitance settings
- [S] Composition/recipe of labeling medium lacking methionine/cysteine
- [S] Method and criteria for scoring histological differentiation (rosettes, keratinization, etc.) quantitatively
- [S] Coulter counter settings/calibration details
- [S] Timing/protocol for RNA isolation and northern blot hybridization conditions (probe concentrations, wash stringency)
- [S] Details of hematoxylin and eosin staining protocol steps/timing
- [S] Sequencing/verification method for the Pl bacteriophage clone genomic fragment
- [S] Nude mouse strain, age, sex used for teratoma studies
H6 — Fbx15 — a dispensable Oct3/4 target turned into a selection marker
Tokuzawa Y, Kaiho E, Maruyama M, Takahashi K, Mitsui K, Maeda M, Niwa H, Yamanaka S. 2003 Mol Cell Biol 23(8):2699-708. PMID 12665572.
The question this paper set out to answer — Only a few Oct3/4 target genes have been identified, and it remains largely unknown how Oct3/4 maintains self-renewal of ES cells; identification of novel Oct3/4 target genes is crucial to answering these questions. This study set out to determine whether the F-box-containing protein Fbx15, identified as an ES-cell-enriched gene by digital differential display, is a direct transcriptional target of Oct3/4, to characterize the regulatory enhancer responsible for its ES cell-specific expression, and to determine the physiological function of Fbx15 in ES cell self-renewal, mouse development, and fertility via gene targeting.
Experiments and results
H6.1 Digital differential display and EST BLAST search
- What was done: Digital Differential Display program was used to compare gene representation between ES-cell-derived EST libraries (nos. 274 and 220, 27,705 entries) and somatic tissue libraries (listed, 1,328,835 entries) to find genes appearing only in ES cell libraries; full-length Fbx15 cDNA was then used as a BLAST query against whole-mouse dbEST (22 July 2000).
- What came out: Fbx15 appeared only in ES-cell-derived libraries among the screened set; BLAST identified 16 cDNA clones corresponding to Fbx15 in ES cell libraries and 39 clones in preimplantation embryo libraries (16 two-cell, 15 eight-cell, 2 sixteen-cell, 6 blastocyst; clones with scores ≥200 bits) but none in unfertilized egg, in vitro-fertilized egg, and other libraries.
- Evidence: "identified 16 cDNA clones corresponding to Fbx15 in libraries from ES cells and 39 clones in libraries from preimplantation embryos"
H6.2 RT-PCR and Western blot expression profiling
- What was done: RT-PCR was performed on MG1.19 ES cells, retinoic acid-differentiated ES cells, and 12 adult mouse tissues for Oct3/4, Fbx15, and NAT1; Western blotting was performed with a generated anti-Fbx15 antiserum (against C-terminal aa297-473) on RF8, J1, CGR8, and MG1.19 ES cell lines before and after 5 days retinoic acid treatment.
- What came out: High Fbx15 expression was seen in undifferentiated ES cells, repressed upon retinoic acid differentiation; testis expressed Fbx15 at lower level than ES cells, faint expression in ovary, no expression in 10 other adult tissues, matching Oct3/4 pattern. Western blot detected a single 55 kDa band in all four undifferentiated ES cell lines that disappeared after 5 days retinoic acid treatment.
- Evidence: "Western blot analyses with the antiserum detected a single band of 55 kDa in four independent ES cell lines, RF8, J1, CGR8, and MG1.19"
H6.3 Oct3/4 conditional knockout (ZHBTc4) Northern blot
- What was done: ZHBTc4 ES cells, in which both Oct3/4 alleles are deleted and self-renewal is maintained by a tetracycline-repressible Oct3/4 transgene, were treated with tetracycline; Northern blot analysis measured Oct3/4 and Fbx15 transcripts at indicated time points.
- What came out: The longer and shorter Oct3/4 transcripts disappeared within 24 and 72 h respectively after tetracycline addition, and Fbx15 expression also disappeared within 72 h after tetracycline addition.
- Evidence: "Expression of Fbx15 also disappeared within 72 h after tetracycline addition."
H6.4 Luciferase reporter enhancer mapping
- What was done: Reporter constructs with Fbx15 5' flanking fragments starting at positions -1120, -640, and -526 (ending at -114) driving luciferase were transfected into undifferentiated ES cells, differentiated ES cells, and NIH 3T3 cells; further deletion/mutation constructs with the minimal thymidine kinase promoter (positions -640 to -527, down to an 18-bp fragment -544 to -527) were tested, including point mutations of the octamer-like sequence (to TCCCTCAT) or Sox site (to AACCAT or ACCCAT).
- What came out: The -640 fragment showed marked enhancement of luciferase activity versus -526, while -1120 gave only small enhancement; all constructs were inactive in differentiated ES cells and NIH 3T3 cells. The 114-bp and 18-bp (-544 to -527) fragments enhanced activity in undifferentiated RF8 ES cells only, not in reverse orientation, differentiated ES cells, or NIH 3T3 cells; deletion or point mutation of the octamer-like or Sox motif abolished enhancer activity.
- Evidence: "the enhancer is located in an 18-bp fragment between positions 544 and 527 that contains the Sox-binding site and the octamer-like motif. Deletion of either of these two sites abolished the enhancer activity"
H6.5 Oct3/4 + Sox2 cotransfection reporter assay in NIH 3T3 cells
- What was done: A reporter with the minimal thymidine kinase promoter and five copies of the Fbx15 enhancer (wild-type or Sox-mutated) was transfected into NIH 3T3 cells alone or with Oct3/4 and/or Sox2 expression vectors (pCAG-Oct3/4-IRES-neo, pCAG-Sox2-IRES-neo) using Lipofectamine 2000; luciferase measured 24 h post-transfection.
- What came out: Reporter alone showed background-level activity in NIH 3T3 cells; Oct3/4 alone or Sox2 alone gave no enhancement; cotransfection of both Oct3/4 and Sox2 gave significant enhancement of luciferase activity; Oct3/4+Sox2 did not enhance the Sox-site-mutated reporter.
- Evidence: "when it was cotransfected with both the Oct3/4 and Sox2 expression vectors, significant enhancement of luciferase activity was achieved"
H6.6 Gel mobility shift assay
- What was done: 32P-labeled Fbx15 enhancer oligonucleotide (WT) and mutant oligonucleotides (octamer mutant O(-), Sox mutant S(-)) were incubated with Cos7 cell extracts expressing HA-Oct3/4, HA-Sox2, or both, and separately with F9 embryonic carcinoma cell nuclear extract; FGF-4 enhancer oligonucleotide served as a positional control.
- What came out: With Oct3/4 alone, no shifted band was observed with Fbx15 enhancer oligo; with both Oct3/4 and Sox2, a shifted complex band appeared, abolished by mutation of either the octamer-like sequence or the Sox site. F9 cell extract produced two shifted bands (Oct3/4-Sox2 complex and Sox2 monomer), both eliminated by excess unlabeled WT oligo; Oct3/4-Sox2 complex band was abolished by mutation of either motif, and the Sox2 monomer band was abolished only by the Sox mutation.
- Evidence: "when they were incubated with cell extracts expressing both Oct3/4 and Sox2, a shifted band corresponding to the complex was observed. This band was abolished by mutation either in the octamer-like sequence or in the Sox-binding site"
H6.7 Fbx15 SCF complex formation (immunoprecipitation)
- What was done: Expression vectors for myc-tagged Fbx15, HA-tagged Cul1, and EGFP-tagged Skp1 were introduced into MG1.19 ES cells (10-cm dishes, 20 µg DNA); after 24 h, myc-Fbx15 was immunoprecipitated with anti-myc antibody and analyzed by Western blot for co-purification of HA-Cul1 and EGFP-Skp1; reciprocal experiment with myc-Skp1/HA-Fbx15 also performed.
- What came out: When myc-Fbx15 was immunoprecipitated, both HA-Cul1 and EGFP-Skp1 were co-purified; when myc-Fbx15 was omitted, neither HA-Cul1 nor EGFP-Skp1 was precipitated. Reciprocal IP of myc-Skp1 also co-purified HA-Fbx15.
- Evidence: "When myc-Fbx15 was immunoprecipitated with anti-myc antibody, both HA-cul1 and EGFP-Skp1 were copurified."
H6.8 Targeted disruption of Fbx15 in ES cells and mice
- What was done: A targeting vector replacing exons 3-7 (F-box domain) with an IRES-β-geo cassette was electroporated into RF8 ES cells; correctly targeted clones identified by Southern blot were used for blastocyst injection into C57BL/6 blastocysts; homozygous ES cell clones were obtained by selection with high-concentration G418 (6 mg/ml); resulting mice, ES cells were characterized by Northern blot, Western blot, X-Gal staining, morphology, proliferation, differentiation with retinoic acid, embryoid body formation, and teratoma formation in nude mice; gain-of-function ES cells constitutively expressing Fbx15 from the CAG promoter were also generated and tested with LIF removal/retinoic acid treatment.
- What came out: 2 correctly targeted clones out of 200 screened were obtained; germline transmission achieved from one clone; homozygous mutant mice were born in Mendelian ratio (+/+, 22; +/-, 43; -/-, 18 out of 83 examined), showed no gross abnormalities, and both sexes were fertile. Homozygous mutant ES cells (2 clones) lacked Fbx15 transcript/protein but were normal in morphology, Oct3/4 expression, proliferation, differentiation by retinoic acid, embryoid body formation, and teratoma formation with all three germ layers. X-Gal staining showed strong activity in undifferentiated mutant ES cells (lost upon differentiation), in testis of adult mice, and in embryos starting at two-cell stage, maximal at eight-cell/blastocyst stage; none in unfertilized eggs or one-cell embryos. Gain-of-function Fbx15-overexpressing ES cells differentiated normally upon LIF removal or retinoic acid and formed normal embryoid bodies/teratomas, indicating Fbx15 alone cannot maintain undifferentiated state.
- Evidence: "Homozygous mutant mice were born from heterozygous intercrossing in accordance with Mendel’s ratio (/, 22; /, 43; /, 18 [out of 83 examined]) and showed no gross abnormalities."
What it made possible next
The paper establishes Fbx15 as a validated Oct3/4-Sox2 target gene with a defined 18-bp composite octamer/Sox enhancer element, generates reagents (anti-Fbx15 antiserum, Fbx15 expression vectors, Fbx15 knockout ES cells and mice, Fbx15-beta-geo reporter knock-in line) and demonstrates a general strategy (reporter/enhancer mapping plus gene targeting) for identifying and testing Oct3/4 downstream targets; because Fbx15 proved dispensable but retains an Oct3/4/Sox2-responsive regulatory element, its enhancer/promoter and knock-in selectable marker system were later exploited (in the same lab's subsequent work) as a marker to select for induced pluripotency in reprogramming screens.
Protocol extraction — [P] values printed in the paper
- [P] NIH 3T3 culture medium = Dulbecco's modified Eagle medium (Sigma) with 10% fetal bovine serum
- [P] NIH 3T3 incubation = 37°C, 5% CO2
- [P] SDS-PAGE gel = SDS-14% polyacrylamide gel
- [P] anti-Skp1 antibody dilution = SC1568, 1/600 (Santa Cruz)
- [P] anti-HA antibody dilution = SC1568, 1/600 (Roche)
- [P] anti-myc antibody dilution = SC789, 1/600 (Santa Cruz)
- [P] anti-GST antibody dilution = SC459, 1/2,000 (Santa Cruz)
- [P] secondary anti-rabbit IgG-HRP dilution = SC2030, 1/5,000 (Santa Cruz)
- [P] secondary anti-rat IgG-HRP dilution = SC2006, 1/5,000 (Santa Cruz)
- [P] reporter plasmid fragment 1 = -526 to -145 (primers mFbx-pro.U637 and mFbx-pro.L1337)
- [P] reporter plasmid name = p(-526/-114)LUC
- [P] upstream reporter fragment starts = -1120 and -640 (primers Fbx-pro.U95 and Fbx-pro.U573)
- [P] common lower primer position = mFbx-pro.L688, 5' end at position -504
- [P] enhancer fragment position = -640 to -527 (primers Fbx-pro.U573 and mFbx-pro.L688)
- [P] Fbx15 enhancer element size = 18-bp (positions -544 to -527)
- [P] Fbx15 C-terminal antigen region = amino acids 297 to 473
- [P] Fbx15 EST accession number = AA571680
- [P] Skp1 EST accession number = AA08144
- [P] Cul1 EST accession number = BE533604
- [P] immunoprecipitation transfection amount = 20 µg expression vector DNA
- [P] immunoprecipitation dish size = 10-cm-diameter dishes
- [P] immunoprecipitation incubation time = 24 h post-transfection
- [P] cell lysis buffer volume = 500 µl M-PER + 10 µl protease inhibitor cocktail
- [P] luciferase assay transfection-to-lysis time = 24 h
- [P] anti-myc IP antibody = agarose-conjugated anti-myc sc40AC (Santa Cruz)
- [P] Fbx15 protein molecular weight = 55 kDa
- [P] dialysis condition = phosphate-buffered saline containing 6 M urea, overnight at 4°C
- [P] gel shift extraction buffer = 20 mM HEPES [pH 7.8], 450 mM NaCl, 0.4 mM EDTA, 0.5 mM dithiothreitol, 25% glycerol, 0.5 mM phenylmethylsulfonyl fluoride
- [P] gel shift electrophoresis buffer = 0.5x Tris-borate-EDTA
- [P] gel prerun time = 10 min
- [P] targeting vector 5' homology arm = 1.4-kbp fragment
- [P] targeting vector 3' homology arm = 3.5-kbp fragment
- [P] Southern blot 5' probe = 600-bp probe from intron 1
- [P] Southern blot 3' probe = 300-bp probe from intron 8
- [P] wild-type band (5' recombination) = 10-kbp (HindIII digest)
- [P] targeted band (5' recombination) = 8-kbp
- [P] wild-type band (3' recombination) = 9-kbp
- [P] targeted band (3' recombination) = 10-kbp
- [P] genotyping PCR wild-type product size = 280-bp
- [P] genotyping PCR targeted product size = 725-bp
- [P] PCR denaturation = 94°C for 2 min
- [P] PCR cycling = 35 cycles of 94°C for 30 s, 53°C for 30 s, 68°C for 1 min
- [P] PCR final extension = 68°C for 7 min
- [P] correctly targeted ES clones obtained = 2 out of 200 screened
- [P] Mendelian ratio of offspring = +/+, 22; +/-, 43; -/-, 18 (out of 83 examined)
- [P] G418 selection concentration for homozygous ES cells = 6 mg/ml
- [P] retinoic acid differentiation duration = 5 days
- [P] gel shift oligonucleotide sequence (WT) = ccagatgtgcTTTATCATAACAATGgaattcctaggggct
- [P] gel shift oligonucleotide mutant (octamer) = ccagatgtgcTCCCTCATAACAATGgaattcctaggggct
- [P] gel shift oligonucleotide mutant (Sox) = ccagatgtgcTTTATCATAACCATGgaattcctaggggct
- [P] FGF-4 enhancer oligonucleotide sequence = tttaagtatcccATTAGCATccaAACAAAGagttttcta
- [P] Fbx15 enhancer consensus sequence = TTTATCATAACAAT
- [P] octamer point mutation sequence = TCCCTCAT
- [P] Sox-binding site mutations = AACCAT or ACCCAT
- [P] transcription initiation site clone yield = 7 of 10 clones started 17 nt upstream
- [P] minor initiation sites = positions -26, -30, -199
- [P] Sox-binding motif location = between positions -534 and -528
- [P] ES-derived EST library numbers = no. 274 and 220 (27,705 entries total)
- [P] somatic tissue EST library count = 1,328,835 entries total
Gaps requiring [S]/[M] — items not stated in the paper
- [S] Composition of ES cell culture medium (LIF concentration, serum type/percentage, feeder layer conditions) for RF8, J1, CGR8, MG1.19 lines
- [S] Seeding density of cells for transfection, luciferase assay, or immunoprecipitation experiments
- [S] Retinoic acid concentration used to induce differentiation
- [S] Exact Lipofectamine 2000 transfection protocol details (DNA:lipid ratio, cell density, medium volume)
- [S] Statistical methods/tests used to determine significance of luciferase fold-induction differences
- [S] Scoring/quantification method for X-Gal staining intensity (e.g., how 'strong' vs 'no' activity was defined)
- [S] Number of biological/technical replicates for luciferase reporter assays, Western blots, and Northern blots
- [S] Composition of buffers A, C, D, E used in Ni-NTA purification of His-tagged Fbx15C
- [S] Duration and conditions of X-Gal/BCIG staining protocol for embryos and tissues
- [S] Electroporation conditions (voltage, capacitance) for introducing targeting vector into RF8 ES cells
- [S] Primer sequences (stated as 'available upon request') for RT-PCR, sequencing, and cloning
- [S] Amount/concentration of 32P-labeled oligonucleotide and unlabeled competitor used in gel shift assay
- [S] Tetracycline concentration used to treat ZHBTc4 ES cells
H7 — ERas — the PI(3)K pathway and ES-cell growth and tumorigenicity
Takahashi K, Mitsui K, Yamanaka S. 2003 Nature 423(6939):541-5. PMID 12774123.
The question this paper set out to answer — To understand why ES cells, despite lacking chromosomal abnormalities, possess tumour-like properties, and to identify genes specifically expressed in ES cells that might explain their propensity to form tumours (teratomas) upon transplantation.
Experiments and results
H7.1 Digital differential display and cDNA cloning of ERas
- What was done: Searched for genes expressed specifically in murine ES cells by digital differential display; identified Unigene cluster Mm.249524 found exclusively in ES cell libraries; obtained full-length cDNA by 5' RACE using primers 45328-AS1 and 45328-race11; BLAST analysis against mouse genomic databases.
- What came out: The gene is located on the X chromosome, contains two exons, and encodes a 227 amino acid protein with 43%, 46% and 47% identity to HRas, KRas and NRas respectively; named ERas.
- Evidence: "The cDNA encodes a protein of 227 amino acids with 43%, 46% and 47% identity to HRas, KRas and NRas, respectively."
H7.2 Re-sequencing of human HRasp pseudogene
- What was done: Searched human genomic databases for ERas homologue; found similarity to HRasp (Ha-Ras2); PCR-amplified HRasp from genomic DNA of two adults using primers hHRAS2-S and hHRAS2-AS, cloned into pCR2.1, and re-sequenced.
- What came out: Previously reported nonsense and deletion mutations did not exist; HRasp has a single open reading frame encoding a polypeptide with 76% identity to mouse ERas, indicating it is the human orthologue of ERas.
- Evidence: "We re-determined the nucleotide sequence of HRasp and found that the previously reported mutations did not exist."
H7.3 Northern/Western blot expression analysis
- What was done: Northern blot analysis of ERas transcript in undifferentiated and differentiated RF8 ES cells, three other ES cell lines (J1, CGR8, MG1.19), and 12 adult mouse somatic tissues; Western blot of four ES cell lines.
- What came out: A single 1.2-kb ERas transcript was detected in undifferentiated ES cells and in J1, CGR8, MG1.19 lines, but not in differentiated ES cells or 12 somatic tissues.
- Evidence: "Northern blot analyses detected a single 1.2-kb ERas transcript in undifferentiated RF8 mouse ES cells (ref. 13 and Fig. 1c)."
H7.4 GTP/GDP association assay
- What was done: Transfected pCAG-IP-Myc tagged mouse ERas, human ERas, HRas, HRasV12 or HRasN17 into MG1.19 cells using Lipofectamine 2000; after 24h evaluated GTP/GDP association using thin-layer chromatography with lysis buffer (20 mM Tris-HCl pH7.5, 150 mM NaCl, 1 mM Na3VO4, 20 mM MgCl2, 0.5% Triton X-100); signals analysed with BAS 5000 imaging plate scanner.
- What came out: 95% of mouse and human ERas was in GTP-bound form, versus ~90% of wild-type HRas in GDP-bound form and ~80% of HRasV12 in GTP-bound form, showing ERas is constitutively active.
- Evidence: "As expected, 95% of mouse and human ERas was in a GTP-bound form."
H7.5 Retroviral transformation assay in NIH 3T3 and MEFs
- What was done: Generated polyclonal NIH 3T3 cell populations expressing ERas or HRasV12 via retroviral gene transfer using PLAT-E packaging cells and pMX-IP vector, selected with 2 microgram/ml puromycin for 4 days; cultured 5,000 cells in soft agar; assessed morphology, contact inhibition, tumour formation in nude mice (1 million cells injected subcutaneously, dissected after 14 days); also tested MEFs (5,000 cells plated, counted at 2,4,6 days).
- What came out: Both mouse and human ERas induced morphological transformation and loss of contact inhibition; soft agar colonies: mouse ERas 992±160, human ERas 934±49, HRasV12 989±86, versus control vector 2±1 and ERas-DC 1±1 colonies; ERas produced tumours in nude mice but smaller than HRasV12; in MEFs, HRasV12 caused premature senescence while ERas increased growth rate.
- Evidence: "we obtained similar numbers (992 ^ 160, 934 ^ 49 and 989 ^ 86) of colonies showing anchorage-independent growth"
H7.6 Sense/antisense ERas transfection in MG1.19 ES cells
- What was done: Transfected sense or antisense ERas cDNA, ERas-DC, or HRasV12 into MG1.19 ES cells via pCAG-IP episomal vector using Lipofectamine 2000; selected with puromycin for 4 days; measured expression by western blot and cell growth (10,000 cells plated, counted after 6 days).
- What came out: Sense ERas increased expression ~fourfold and significantly enhanced growth; ERas-DC had no growth effect; HRasV12 caused differentiation and growth retardation; antisense ERas decreased expression to a fifth of normal and significantly repressed growth.
- Evidence: "expression of ERas increased roughly fourfold (Fig. 3a) and cell growth was significantly enhanced (Fig. 3b)."
H7.7 Targeted disruption (knockout) of ERas in RF8 ES cells
- What was done: Constructed targeting vector replacing ERas coding region with beta-geo fusion, electroporated into RF8 ES cells, identified targeted clones by PCR and Southern blot; established two knockout clones and two rescue clones re-expressing ERas cDNA; assessed morphology, Oct3/4 expression, blastocyst injection for germline transmission, cell expansion over 16 days without feeder cells, and teratoma formation (1 million cells injected subcutaneously, dissected/weighed after 28 days).
- What came out: ERas-null cells maintained pluripotency (normal Oct3/4 expression, germline transmission, no gross abnormalities) but grew significantly slower: wild-type cells expanded 6x10^5 times over 16 days vs 1x10^3 times for ERas-null cells; tumour weights were WT 1.54±0.54 g, KO 0.29±0.21 g, KO+cDNA 0.93±0.58 g (n=10,16,14); re-expression of ERas partially rescued growth and tumorigenicity.
- Evidence: "Wild-type ES cells expanded 6 £ 105 times under these suboptimal conditions over 16 d, whereas the ERas-null cells expanded only 1 £ 103 times."
H7.8 PI(3)K interaction, Akt phosphorylation, and rescue with active PI(3)K
- What was done: Co-immunoprecipitation of Myc-tagged ERas/HRasV12/HRas variants with HA-Raf1, HA-BRaf, or HA-PI(3)K-p110delta in MG1.19 cells; western blot for phosphorylated (Ser473) and total Akt in WT, KO, and KO+myr-p110 ES cells; transferred pCAG-myr-p110-IH into ERas-deficient ES cells by electroporation, screened with 100 microgram/ml hygromycin B; measured cell growth (10,000 cells, counted after 6 days) and teratoma formation (1 million cells, dissected/weighed after 16 days); tested growth-promoting activity with PI(3)K inhibitor LY294002 and MAPK kinase inhibitor PD098059.
- What came out: HRasV12 but not ERas associated with Raf1 and BRaf; ERas, like HRasV12, associated with PI(3)K p110delta; Akt phosphorylation was decreased in ERas-null cells and partially recovered by ERas re-expression; forced expression of active PI(3)K in ERas-null cells increased Akt phosphorylation above wild-type, reverted growth to wild-type levels, and rescued/accelerated teratoma formation; ERas growth-promoting activity was blocked by LY294002 but not PD098059.
- Evidence: "Co-immunoprecipitation experiments showed that HRasV12, but not ERas, associates with Raf1 (Fig. 4a) and BRaf (Supplementary Fig. S2a)."
What it made possible next
Identification of ERas as an ES-cell-specific constitutively active Ras-like gene that signals through PI(3)K (not Raf/MAPK) to drive ES cell growth and tumorigenicity provides a defined molecular target/pathway (ERas-PI(3)K-Akt) and reagents (ERas cDNA, knockout ES cell lines, antibodies, expression constructs) for future work aimed at uncoupling ES cell proliferative/tumorigenic capacity from pluripotency, relevant to safer stem cell therapeutics.
Protocol extraction — [P] values printed in the paper
- [P] Growth assay temperature = 30°C (yeast, unrelated section)
- [P] Retroviral infection: PLAT-E cells plated at 8x10^6 in 100-mm dish
- [P] Retroviral infection: FuGENE6 transfection, incubated 24 h
- [P] Polybrene concentration = 4 microgram/ml
- [P] Puromycin selection (NIH3T3/MEF) = 2 microgram/ml for 4 days
- [P] Puromycin selection (ES cells) = 4 days (concentration not stated)
- [P] Hygromycin B selection = 100 microgram/ml
- [P] NIH 3T3 soft agar assay = 5,000 cells plated
- [P] MEF growth assay = 5,000 cells plated, counted at 2, 4, 6 days
- [P] Cell number, nude-mouse tumour assay = one million cells injected subcutaneously; tumours dissected after 14 d [source prints 'One million cells']
- [P] Cell number, teratoma assay (KO) = one million cells injected subcutaneously [source prints 'One million cells']
- [P] Cell number, teratoma assay (PI3K rescue) = one million cells injected subcutaneously [source prints 'One million of the cells']
- [P] Cell number, growth assay = ten thousand cells plated, counted every other day for 14 d [source prints 'Ten thousand cells were plated']
- [P] ES cell expansion assay = 1x10^4 cells per well in 24-well plates, counted after 4 days, repeated for 4 passages (16 days total)
- [P] Cell number, NIH 3T3 growth assay (Fig 2c) = ten thousand cells plated, counted every other day for 14 d [as printed]
- [P] GTP/GDP association assay lysis buffer = 20 mM Tris-HCl (pH 7.5), 150 mM NaCl, 1 mM Na3VO4, 20 mM MgCl2, 0.5% Triton X-100, protease inhibitor cocktail
- [P] GTP/GDP association incubation = 24 h post-transfection
- [P] Transfection reagent = Lipofectamine 2000 (Invitrogen)
- [P] Vector for episomal ES cell expression = pCAG-IP (contains Polyoma replication origin)
- [P] Vector for retroviral expression = pMX-IP
- [P] Mouse ERas GenBank accession = AB093573
- [P] Human ERas GenBank accession = AB093575
- [P] GTP-bound fraction calculation = GTP/(GTP + 1.5 x GDP)
Gaps requiring [S]/[M] — items not stated in the paper
- [S] Exact antibody dilutions used for western/immunohistochemistry of ERas
- [S] Exact sequences of primers 45328-AS1, 45328-race11, hHRAS2-S, hHRAS2-AS (referred to Supplementary Information, not printed here)
- [S] Statistical test details (e.g., exact p-values beyond thresholds <0.05/<0.01) for each figure comparison
- [S] Exact puromycin concentration used for ES cell selection (only stated for NIH3T3/MEF as 2 microgram/ml)
- [S] Number of independent experiments/replicates (n) for GTP/GDP assay, Northern/Western blots, and co-immunoprecipitation experiments
- [S] Composition of media used for ES cell culture (e.g., LIF concentration, serum percentage)
- [S] Exact age/source details of human genomic DNA donors used for HRasp sequencing
- [S] Full construction details of expression vectors (referred to Supplementary Information)
- [S] Exact cell cycle analysis method/reagents used to generate G1/S/G2 percentages
H8 — Nanog and the ECAT set — the making of a candidate-gene catalogue
Mitsui K, Tokuzawa Y, Itoh H, Segawa K, Murakami M, Takahashi K, Maruyama M, Maeda M, Yamanaka S. 2003 Cell 113(5):631-42. PMID 12787504.
The question this paper set out to answer — To identify the LIF/Stat3-independent factor(s) that underlies pluripotency in both ICM and ES cells, by conducting digital differential display to find genes expressed in ES cells as specifically as oct3/4, and exploring their functions via constitutive expression and targeted gene disruption.
Experiments and results
H8.1 Digital differential display and Northern blot screening for ecat genes
- What was done: Digital differential display compared EST libraries from mouse ES cells versus various somatic tissues to identify overrepresented genes; Northern blot analysis of candidate ecat genes was performed on 5 micrograms of total RNA using mouse cDNA probes, including comparison of undifferentiated ES cells and cells differentiated with retinoic acid (3x10^-7 M) for 5 days.
- What came out: Table 1 identified top 20 genes enriched in ES cells including oct3/4, utf1, rex1, and nine uncharacterized genes designated ecat1-9 (including ecat4/nanog); Northern blot confirmed ES cell-specific expression in nine uncharacterized ecat genes.
- Evidence: "Northern blot analyses confirmed ES cell-specific expression in nine uncharacterized genes (Figure 1). We designated these genes ecat, for ES cell associated transcripts."
H8.2 Constitutive expression of ecat genes, oct3/4, and sox2 in ES cells (supertransfection)
- What was done: Coding regions of ecat genes, oct3/4, or sox2 were introduced via Gateway technology into pPyCAGIP vector and transfected into MG1.19 ES cells using LipofectAMINE 2000; puromycin selection (2 microgram/ml) was used; cells were cultured with or without LIF for up to 1 month to assess morphology and oct3/4 expression by RT-PCR.
- What came out: Oct3/4 overexpression caused differentiation; Ecat9 and Sox2 induced massive cell death. Of eight other Ecats stably expressed, all but one (ecat4) differentiated (flattened morphology, reduced oct3/4) when LIF was removed. Cells constitutively expressing ecat4 (renamed nanog) maintained normal morphology and normal oct3/4 expression even after 1 month without LIF.
- Evidence: "In contrast, cells constitutively expressing ecat4 did not show such a morphological change even after prolonged culture (1 month) without LIF (Figure 2A). Expression of oct3/4 also remained normal (Figure 2B)."
H8.3 Characterization of CAG-nanog cells (Stat3 kinetics, growth)
- What was done: CAG-nanog and mock-transfected MG1.19 cells were analyzed by RT-PCR (nanog, oct3/4, nat1), Western blot with anti-Nanog antiserum and anti-Cdk4 antibody, LIF removal for 60 min then re-addition with lysates collected over time blotted for Nanog, Oct3/4, phospho-Stat3(Tyr705), and Stat3; growth assay with 10,000 cells/well of 24-well plates cultured with or without LIF for 5 days, cell counted, averaged over four independent experiments.
- What came out: CAG-nanog cells expressed significantly more nanog transcript and protein than controls, sustained after prolonged culture without LIF; Stat3 activation kinetics were unchanged; growth speed was faster than control cells but significantly decreased by LIF removal.
- Evidence: "Stat3 activation kinetics was unchanged (Figure 2D). Growth speed was faster than control cells but significantly decreased by LIF removal (Figure 2E)."
H8.4 Nanog cDNA sequencing and expression profiling
- What was done: nanog cDNA (2184 nt) was sequenced; RT-PCR and Northern blot analysis of nanog, oct3/4, nat1 expression in undifferentiated/differentiated ES cell lines (MG1.19, RF8) and twelve somatic organs (brain, heart, kidney, testis, spleen, muscle, lung, stomach, ovary, thymus, liver, skin); Western blot with anti-Nanog rabbit antiserum raised against histidine-tagged Nanog protein performed on four independent ES cell lines (RF8, MG1.19, J1, CGR8) undifferentiated or treated with retinoic acid for 5 days.
- What came out: nanog cDNA contains a single ORF encoding a 305 amino acid polypeptide with a homeobox domain most similar to the Nk-2 family (less than 50% identity); transcripts not detectable in twelve somatic organs by Northern or RT-PCR; Western blot detected specific 35 kDa band in four ES cell lines; retinoic acid treatment decreased Nanog protein levels in all four lines.
- Evidence: "Transcripts of nanog were not detectable in twelve somatic organs, including testis and ovary, by either Northern blot (Figure 1) or RT-PCR (Figure 3B)."
H8.5 Targeted disruption of nanog gene in ES cells
- What was done: Two targeting vectors replacing exon 2 (homeodomain) with IRES-betageo or IRES-hygromycin-resistance cassettes were introduced into RF8 ES cells by electroporation; homologous recombination screened by PCR and confirmed by Southern blot; homozygous mutant ES cells obtained by sequential targeting of both alleles; marker gene expression analyzed by Northern blot and RT-PCR; growth measured by plating 1x10^4 cells/well of 24-well plates and counting at 2, 4, 6 days.
- What came out: With betageo vector, 27/96 colonies positive by PCR; with hygr vector, 8/27 positive. In second round, 34/83 hygr-resistant clones showed homologous recombination, 11 clones homozygous; in reciprocal order 114/397 G418-resistant clones positive, 6 homozygous. nanog null ES cells were larger, round-shaped on feeders, flattened into parietal endoderm-like morphology without feeders, grew significantly slower than heterozygous cells, but could be passaged for at least 2 months; they expressed endoderm markers (gata4, gata6) and reduced but not eliminated oct3/4 and rex1; mesoderm, trophoblast, primitive ectoderm, neuroectoderm markers were not induced.
- Evidence: "Cells deficient in nanog grew significantly slower that heterozygous ES cells (Figure 5B) but could be serially passaged for at least 2 months (data not shown)."
H8.6 Generation and analysis of nanog-deficient mice/embryos
- What was done: Heterozygous betageo ES cells injected into C57BL/6 blastocysts to generate chimeric mice; germline transmission obtained from three independent ES clones; heterozygous intercrosses performed; embryos analyzed at 7.5 dpc (decidual swellings), E5.5 (histology), and 3.5 dpc (blastocysts); X-Gal staining of preimplantation embryos; ICM isolated by immunosurgery and cultured on gelatin-coated plates with ES cell medium for 4-10 days.
- What came out: 231 mice born from heterozygous intercrosses: 80 wild-type, 151 heterozygous, 0 homozygous. Of 36 decidual swellings at 7.5 dpc: 14 wild-type, 16 heterozygous, 6 empty. Of 33 E5.5 embryos: 26 normal, 7 (indicating null) consisted entirely of disorganized extraembryonic tissues with no discernible epiblast. Of 15 blastocysts at 3.5 dpc, 3 were homozygous and indistinguishable from normal embryos, but ICM of nanog null blastocysts failed to proliferate on gelatin-coated plates; after immunosurgery, nanog-deficient ICM differentiated completely into parietal endoderm-like cells within 4 days without trophoblast differentiation.
- Evidence: "ICM deficient in nanog did not persist as undifferentiated masses in vitro but differentiated completely into parietal endoderm-like cells within 4 days (Figure 6D)."
H8.7 SELEX identification of Nanog DNA recognition sequence
- What was done: Mouse nanog coding region introduced into pIH1119 to produce MBP-Nanog fusion protein, induced in E. coli BL21AI, purified with amylose beads; SELEX performed using double-stranded oligonucleotide library (SELEX-N20-Oligo) through five rounds of selection/PCR amplification; final products cloned into pCR2.1 vector; 30 clones randomly selected and sequenced; gel-mobility shift assay performed with 32P-labeled consensus or mutated oligonucleotides incubated with nuclear extracts of F9 embryonic carcinoma cells and RF8 ES cells.
- What came out: Consensus binding sequence identified as (C/G)(G/A)(C/G)C(G/C)ATTAN(G/C) with highest conservation at tetramer ATTA, differing from NK-2 family consensus T(C/T)AAGTG. Gel-mobility shift assay showed mobility of consensus oligonucleotides was retarded by F9 cell extracts and RF8 ES cell extracts; shift abolished by excess unlabeled consensus oligonucleotide but not by ATTA-mutated oligonucleotide.
- Evidence: "we identified a consensus sequence (C/G)(G/A)(C/G)C(G/C)ATTAN(G/C) (Figure 7A). The highest conservation was observed with the tetramer ATTA."
What it made possible next
Identification and cloning of the mouse nanog gene/cDNA (GenBank AB093574), a validated anti-Nanog antiserum, nanog knockout ES cell lines and knockout mouse strain, a constitutive Nanog overexpression (CAG-nanog) ES cell system enabling LIF-independent self-renewal, and a defined Nanog DNA-binding consensus sequence—together providing tools and rationale for downstream studies of pluripotency regulatory networks (e.g., reporter assays, gel-shift studies of gata6/rex1 regulation, and later use of Nanog as a reprogramming factor).
Protocol extraction — [P] values printed in the paper
- [P] Total RNA per Northern blot = 5 micrograms
- [P] Retinoic acid concentration for ES cell differentiation = 3 x 10^-7 M
- [P] Retinoic acid treatment duration = 5 days
- [P] Nanog cDNA length = 2184 nucleotides
- [P] Nanog ORF encodes = 305 amino acids
- [P] 3' UTR length = 1077 nt (containing B2 repetitive element)
- [P] Nanog protein size (Western blot) = 35 kDa
- [P] Cells per well for growth assay = 10,000 cells per well of 24-well plates
- [P] Culture duration without LIF for growth assay = 5 days
- [P] Number of independent experiments (growth assay) = four
- [P] Prolonged culture without LIF = 1 month
- [P] Cdk4 antibody = Santa Cruz sc-260-G
- [P] Oct3/4 antibody = Santa Cruz sc-5279
- [P] Phospho-Stat3 (Tyr705) antibody = Cell Signaling Technology #9131
- [P] Stat3 antibody = Santa Cruz sc-482
- [P] LIF removal duration = 60 min
- [P] Puromycin selection concentration = 2 microgram/ml
- [P] PCR positive clones with geo targeting vector = 27 out of 96 colonies
- [P] PCR positive clones with hygr targeting vector = 8 out of 27
- [P] Homozygous clones obtained via hygr into heterozygous (geo) = 11 out of 34 (out of 83 hygromycin-resistant clones)
- [P] Homozygous clones obtained via geo into heterozygous (hygr) = 6 out of 114 (out of 397 G418-resistant clones)
- [P] Southern blot band sizes = 11 kb (wild type), 15.4 kb (geo-targeted), 7.3 kb (hygr-targeted)
- [P] PCR product sizes = 3.2 kb (wild type), 8.5 kb (geo-targeted), 4.2 kb (hygr-targeted)
- [P] Cell plating density for growth curve of nanog +/- and -/- clones = 1 x 10^4 cells per well of 24-well plates
- [P] Growth curve counting timepoints = 2, 4, and 6 days
- [P] ZHBTc4 cells cultured with tetracycline duration = 96 hr
- [P] Mice born from heterozygous intercrosses = 231 total (80 wild-type, 151 heterozygous)
- [P] Decidual swellings examined at 7.5 dpc = 36 (14 wild-type, 16 heterozygous, 6 empty)
- [P] E5.5 embryos examined = 33 (26 normal, 7 abnormal/nanog null)
- [P] Blastocysts examined at 3.5 dpc = 15 (3 homozygous)
- [P] ICM culture duration after immunosurgery = 4 days
- [P] Blastocyst culture duration on gelatin-coated plate = 10 days
- [P] Section thickness for histology = 5 micrometer
- [P] Fixation = 10% buffered formalin
- [P] Acidic Tyrode's solution treatment = 1 min at room temperature
- [P] Anti-mouse antiserum incubation = 10 min at 37C, diluted 20 times in M16 medium
- [P] Guinea pig complement incubation = 30 minutes at 37C, diluted 20 times in M16 medium
- [P] SELEX rounds of enrichment = five times
- [P] SELEX clones sequenced = Thirty clones
- [P] SELEX PCR = initial denaturation 95C for 5 min, 20 cycles of 95C for 1 min, 54C for 1.5 min, 72C for 1 min, final extension 72C for 7 min
- [P] SELEX DNA-protein binding = 4C for 30 min
- [P] SELEX oligonucleotide denaturation/annealing = 95C for 5 min, annealed at 54C for 5 min
- [P] Klenow fragment reaction = 0.225 U in 3.6 microliter, 25C for 40 min
- [P] Bead washing = six times with 100 microliter lysis buffer
- [P] E. coli strain for SELEX fusion protein expression = BL21AI (Invitrogen)
- [P] Expression vector for fusion protein = pIH1119
- [P] ES cell expression vector = pPyCAGIP
- [P] Blastocyst injection recipient strain = C57BL/6
- [P] RF8 ES cell line reference = Meiner et al. 1996
- [P] MG1.19 ES cell line reference = Gassmann et al. 1995
- [P] J1 ES cell line reference = Li et al. 1992
- [P] CGR8 ES cell line reference = Nichols et al. 1990
- [P] GenBank accession number for mouse nanog cDNA = AB093574
- [P] PCR primers = 6047-insS1.2 (CACCTACCACCATGCCAGGCTGAGAATGTC) and 6047-RACE1 (AGCTGGCATCGGTTCATCATGGTACA)
- [P] 5' arm PCR primers = S4 (AGGGTCTGCTACTGAGATGCTCTG) and AS4 (AGGCAGGTCTTCAGAGGAAGGGCG)
- [P] 3' arm PCR primers = IntS3.2 (CGGGCTGTAGACCTGTCTGCATTCTG) and RACE2 (GGTCCTTCTGTCTCATCCTCGAGAGT)
- [P] 5' arm fragment size = 4 kb (intron 1)
- [P] 3' arm fragment size = 1.5 kb (exon 3, intron 3, exon 4)
- [P] nanog RT-PCR primers = 6047-S4 (AGGGTCTGCTACTGAGATGCTCTG) and 6047-AS5 (CAACCACTGGTTTTTCTGCCACCG)
- [P] oct3/4 RT-PCR primers = Oct3/4-U474 (CTGAGGGCCAGGCAGGAGCACGAG) and Oct3/4-L935 (CTGTAGGGAGGGCTTCGGGCACTT)
- [P] nat1 RT-PCR primers = NAT1-U283 (ATTCTTCGTTGTCAAGCCGCCAAAGTGGAG) and NAT1-L476 (AGTTGTTTGCTGCGGAGTTGTCATCTCGTC)
- [P] cdx2 RT-PCR primers = Cdx2-S775 (GGCGAAACCTGTGCGAGTGGATGCGGAA) and Cdx2-AS1210 (GATTGCTGTGCCGCCGCCGCTTCAGACC)
- [P] lamininB1 RT-PCR primers = LimB.S354 (CTGTTCTGAAAGTGAATGTGGTGGCCCC) and LamB-AS945 (GTTTAATCGCCTTCTCTGCTGCAACCTG)
- [P] thrombomodulin RT-PCR primers = TM-S1071 (CCAGGCTCTTACTCCTGTA) and TM-AS1300 (TGGCACTGAAACTCGCAGTT)
- [P] SELEX oligo primers = SELEX-N20FW (TAGGCATGTGGATCCGTCTGGC) and SELEX-N20RV (ATCGAAGGTGGATCCGGTACGC)
- [P] SELEX random oligo = SELEX-N20-Oligo (TAGGCATGTGGATCCGTCTGGCN20GCGTACCGGATCCACCTTCGAT), 1 microgram
- [P] Binding buffer composition = 100 mM HEPES-KOH pH 7.9, 1 mM EDTA, 1 M KCl, 50% Glycerol
- [P] Lysis buffer composition = 20 mM Tris-HCl pH 7.4, 200 mM NaCl, 1 mM EDTA, supplemented with 1 mM DTT and 0.2 mM PMSF
Gaps requiring [S]/[M] — items not stated in the paper
- [S] Full composition of the ES-cell culture medium (not stated in the paper)
- [S] Feeder-cell type and density (not stated in the paper)
- [S] Serum type and concentration (not stated in the paper)
- [S] Scoring criteria for colonies/phenotypes (not stated in the paper)
- [S] Name of the statistical method used (not stated in the paper)
H9 — iPS — from 24 factors to four
Takahashi K, Yamanaka S. 2006 Cell 126(4):663-76. PMID 16904174.
The question this paper set out to answer — To test whether factors important for maintaining ES cell identity/pluripotency could, when introduced into somatic fibroblasts, induce those cells to become pluripotent stem cells (i.e., whether pluripotency can be induced directly in somatic cells by defined factors, rather than only via nuclear transfer or ES cell fusion).
Experiments and results
H9.1 24-factor screen with Fbx15 G418 selection assay
- What was done: 24 candidate ES-cell-identity genes were retrovirally transduced individually or together into Fbx15bgeo/bgeo MEFs (bgeo knockin into Fbx15 locus enabling G418 resistance as readout of pluripotency activation); cells were selected in G418 (0.3 mg/ml) and observed for colony formation.
- What came out: No single factor produced G418-resistant colonies, but transduction of all 24 factors together generated 22 G418-resistant colonies (repeat experiment: 29 colonies); of 12 clones continued in culture, 5 exhibited ES-cell-like morphology.
- Evidence: "transduction of all 24 candidates together generated 22 G418-resistant colonies"
H9.2 Narrowing to 10 and then 4 factors
- What was done: Individual factors were withdrawn from the 24-factor pool and then from a narrowed 10-factor pool transduced into Fbx15bgeo/bgeo MEFs, and colony formation was scored 10 or 16 days after transduction; four-factor (Oct3/4, Sox2, c-Myc, Klf4) and combinations of three or two factors were also tested.
- What came out: Withdrawal of 10 factors (3,4,5,11,14,15,18,20,21,22) abolished colonies; from the 10-factor pool, removing Oct3/4 or Klf4 abolished colonies, removing Sox2 left only a few colonies, removing c-Myc gave flatter non-ES-like colonies; the 4-factor combination (Oct3/4, Sox2, c-Myc, Klf4) produced colony numbers similar to the 10-factor pool, whereas no 2-factor combination produced colonies.
- Evidence: "G418-resistant colonies did not form when either Oct3/4 (factor 14) or Klf4 (factor 20) was removed."
H9.3 Growth and morphology characterization of iPS-MEF24 clones
- What was done: Growth curves were generated for iPS-MEF24 clones (2-1 to 2-4) alongside ES cells and MEFs, passaging 3x10^5 cells every 3 days into six-well plates; morphology compared by microscopy.
- What came out: Doubling times of iPS-MEF24 clones were 19.4, 17.5, 18.7, and 18.6 hr, equivalent to ES cells' 17.0 hr doubling time; iPS cells showed ES-like round shape, large nucleoli, scant cytoplasm.
- Evidence: "The doubling time of these cells (19.4, 17.5, 18.7, and 18.6 hr) was equivalent to that of ES cells (17.0 hr)."
H9.4 Marker gene expression and DNA methylation analysis
- What was done: RT-PCR for ES cell marker genes (Oct3/4, Nanog, E-Ras, Cripto, Dax1, Zfp296, Fgf4) and bisulfite genomic sequencing of Oct3/4, Nanog, and Fbx15 promoters were performed in iPS-MEF24, iPS-MEF4, iPS-MEF10, iPS-MEF3 clones, ES cells, and MEFs.
- What came out: iPS-MEF24 clones expressed ES marker genes; Fbx15 and Nanog promoters were demethylated in iPS cells while Oct3/4 promoter remained methylated in iPS-MEF24; iPS-MEF3 cells failed to activate Ecat1, Esg1, Sox2, and had only weak/absent Oct3/4 activation.
- Evidence: "Bisulfite genomic sequencing demonstrated that the promoters of Fbx15 and Nanog were demethylated in iPS cells"
H9.5 Global gene expression microarray comparison
- What was done: DNA microarray analysis (Agilent Mouse Oligo Microarray, 10,517 probes) compared ES cells, iPS cells (MEF4-7, MEF10-6, MEF3-2, MEF3-3), MEFs, four-factor-transduced MEFs without selection, K-RasV12-immortalized MEFs, and H-RasV12-transformed NIH 3T3 cells; Pearson correlation clustering was performed.
- What came out: iPS cells clustered closely with ES cells but separately from fibroblasts and derivatives; group I genes (Myb, Kit, Gdf3, Zic3) upregulated in both ES and iPS cells; group II genes (Dppa3/4/5, Nanog, Sox2, Esrrb, Rex1) upregulated more in ES, iPS-MEF4, iPS-MEF10 than iPS-MEF3; group III genes (Dnmt3a/3b/3l, Utf1, Tcl1, LIF receptor) more upregulated in ES than iPS cells.
- Evidence: "Pearson correlation analysis revealed that iPS cells are clustered closely with ES cells but separately from fibroblasts and their derivatives"
H9.6 Teratoma formation assay
- What was done: iPS-MEF10, iPS-MEF4, iPS-MEF4wt, and iPS-MEF3 clones (1x10^6 cells in 100 µl subcutaneously) were injected into nude mice; tumors were dissected after 4 weeks, sectioned, and stained with H&E for histological examination.
- What came out: Tumors obtained from 5 iPS-MEF10, 3 iPS-MEF4, 1 iPS-MEF4wt, and 6 iPS-MEF3 clones; 2 iPS-MEF10 clones (3,6), 2 iPS-MEF4 clones (2,7), and iPS-MEF4wt-4 differentiated into all three germ layers including neural tissue, cartilage, columnar epithelium; iPS-MEF10-6 retained tri-lineage differentiation after 30 passages; all iPS-MEF3-derived tumors were composed entirely of undifferentiated cells.
- Evidence: "all tumors derived from iPS-MEF3 clones were composed entirely of undifferentiated cells"
H9.7 Blastocyst injection / chimera contribution assay
- What was done: iPS-TTFgfp4 clones 3 and 7 (derived from adult tail-tip fibroblasts expressing GFP, transduced with the four factors) were microinjected into C57/BL6 blastocysts and embryos examined for GFP contribution and histology at E7.5/E13.5; some injected blastocysts were allowed to develop to term.
- What came out: With iPS-TTFgfp4-3, 2 of 18 embryos at E13.5 showed GFP-positive contribution to all three germ layers; with iPS-TTFgfp4-7, 3 of 22 embryos at E7.5 were GFP-positive; 27 pups were born from the two clones but none were chimeric.
- Evidence: "With iPS-TTFgfp4-3, we obtained 18 embryos at E13.5, 2 of which showed contribution of GFP-positive iPS cells"
H9.8 iPS cell generation from adult tail-tip fibroblasts (TTFs)
- What was done: The four selected factors (Oct3/4, Sox2, c-Myc, Klf4) were retrovirally introduced into TTFs from 7-week-old male and 12-week-old female (GFP-expressing) Fbx15bgeo/bgeo mice, followed by G418 selection and clone establishment; marker gene expression assessed by RT-PCR, and tumorigenicity tested by subcutaneous injection.
- What came out: 3 G418-resistant colonies from male TTFs yielded iPS-TTF4 lines; 13 colonies from female GFP TTFs yielded 6 iPS-TTFgfp4 clones (plus an additional loxP-flanked clone 7); 2 iPS-TTF4 and 6 iPS-TTFgfp4 clones transplanted into nude mice all produced tumors containing tissues of all three germ layers.
- Evidence: "We transplanted 2 iPS-TTF4 and 6 iPS-TTFgfp4 clones into nude mice, all of which produced tumors containing tissues of all three germ layers"
What it made possible next
Identification of a minimal four-factor combination (Oct3/4, Sox2, c-Myc, Klf4) sufficient to reprogram mouse embryonic and adult fibroblasts into induced pluripotent stem (iPS) cells using retroviral transduction and a selectable reporter (Fbx15-bgeo or later other ES marker reporters), providing a defined-factor reprogramming protocol, retroviral vectors (pMXs-based), and characterization assays (RT-PCR marker panels, bisulfite sequencing, ChIP, teratoma assay, blastocyst injection) that later studies could use/extend (e.g., to human cells, other reporters such as Nanog).
Protocol extraction — [P] values printed in the paper
- [P] G418 concentration (Fbx15bgeo/bgeo ES cells resistance) = up to 12 mg/ml
- [P] G418 concentration (normal, somatic cells) = 0.3 mg/ml
- [P] G418 final concentration used for selection = 0.3 mg/ml
- [P] G418 selection duration = 2 to 3 weeks
- [P] G418-resistant colony scoring timepoints = 10 days and 16 days after transduction
- [P] Number of candidate genes screened = 24
- [P] MEF passage cells used = within three passages
- [P] MEF isolation trypsin/EDTA = 0.1 mM trypsin/1 mM EDTA, 3 ml per embryo
- [P] MEF isolation trypsinization time = 20 min at 37°C (x2, total 40 min)
- [P] MEF isolation centrifugation = 200 x g for 5 min at 4°C
- [P] MEF plating density = 1 x 10^6 cells (passage 1) on 100 mm dishes
- [P] TTF culture in MF-start medium duration = 5 days
- [P] TTF passage used for induction = passage 3
- [P] MEF/TTF seeding for retroviral infection = 8 x 10^5 cells per 100 mm dish
- [P] Plat-E cell seeding density = 8 x 10^6 cells per 100 mm dish
- [P] Fugene 6 transfection reagent volume = 27 microliters diluted in 300 ml DMEM
- [P] Fugene 6 incubation time = 5 min at room temperature
- [P] Plasmid DNA amount for transfection = 9 micrograms
- [P] DNA/Fugene 6 mixture incubation = 15 min at room temperature
- [P] Polybrene concentration = 4 mg/ml
- [P] Virus filter pore size = 0.45 mm cellulose acetate filter
- [P] Infection duration = 4 hr to overnight
- [P] Time to G418 addition after infection = 3 days
- [P] Plat-E culture medium = DMEM containing 10% FBS, 50 units/50 mg/ml penicillin/streptomycin, 1 mg/ml puromycin, 100 mg/ml blasticidin S
- [P] LIF conditioned medium dilution = 1:10,000
- [P] ES/iPS cell passaging interval = every 3 days
- [P] Cell number for growth curve passaging = 3 x 10^5 cells per well of six-well plates
- [P] Doubling times of iPS-MEF24 clones = 19.4, 17.5, 18.7, and 18.6 hr
- [P] Doubling time of ES cells = 17.0 hr
- [P] Teratoma cell suspension concentration = 1 x 10^7 cells/ml in DMEM with 10% FBS
- [P] Teratoma injection volume/number = 100 ml (1 x 10^6 cells) subcutaneous injection
- [P] Time to tumor dissection = 4 weeks after injection
- [P] Tumor fixation = PBS containing 4% formaldehyde
- [P] Bisulfite sequencing clones sequenced per gene = 10 randomly selected clones
- [P] Feeder-free culture test cell number = 1000 cells on gelatin-coated six-well plates for 5 days
- [P] TTF donor mouse ages = 7-week-old male and 12-week-old female
- [P] Embryos harvested for blastocyst injection = 18 embryos at E13.5 (clone 3), 22 embryos at E7.5 (clone 7)
- [P] Chimeric pups obtained = 27 pups born, none chimeric
- [P] Southern blot restriction enzymes = EcoRI and BamHI
- [P] ChIP antibodies = anti-dimethyl K9 H3 (ab7312-100, Abcam) and anti-acetyl H3 (06-599, Upstate)
- [P] Western blot antibodies = anti-Oct3/4 (C-10, Santa Cruz), anti-Klf4 (H-180, Santa Cruz), anti-c-Myc (A-14, Santa Cruz), anti-p53 (FL-393, Santa Cruz), anti-b-actin (A5441, Sigma)
- [P] SSEA-1 antibody = mouse monoclonal (480, Santa Cruz)
- [P] Immunostaining antibodies = anti-alpha-smooth muscle actin (N1584, Dako), anti-alpha-fetoprotein (N1501, Dako), anti-bIII tubulin (CBL412, Abcam)
- [P] Statistical significance thresholds = *p<0.05; **p<0.01
- [P] Microarray probes analyzed = 10,517 probes
- [P] Real-time PCR system = ABI7300
- [P] Bacterial backcrossing = C57/BL6 strain for at least five generations
Gaps requiring [S]/[M] — items not stated in the paper
- [S] Full composition of ES cell/iPS medium (base medium, serum %, supplements like LIF, non-essential amino acids, 2-mercaptoethanol) not detailed
- [S] STO feeder cell seeding density and mitomycin C treatment concentration/duration not given
- [S] RT-PCR/PCR cycling conditions (annealing temp, cycle number, extension times) not stated
- [S] Primer sequences (referred to Table S9, not in main text)
- [S] Statistical test details for growth curve/teratoma frequency (e.g., n replicates, exact test) not fully specified in main text
- [S] Scoring rubric for 'ES cell-like morphology' or pluripotency classification not operationally defined
- [S] Exact composition/formulation of MF-start medium not given
- [S] Embryoid body formation protocol details (dish type, medium volume, days beyond noted 3+3 days) incomplete
- [S] Amount/volume of retroviral supernatant applied to target cells not stated
- [S] Age/strain details for all fibroblast donor mice beyond a few examples not fully specified
- [S] Karyotyping method staining protocol details (quinacrine-Hoechst) beyond naming not described
- [S] DNA microarray labeling/hybridization protocol quantities (RNA amount, hybridization time/temperature) not given
Machine Traces of Discovery Paths #2 — Evidence 2 of 4 · The reagent chain
Verifiable source document for the Deep Dive essay Machine Traces of Discovery Paths #2 — The Path to iPS Discovery, A Comprehensive Analysis and Reconstruction. This document records, for each transition in the nine-paper path, the specific reagent or method one paper handed to the next, why the later paper could not have proceeded without it, and the provenance on both sides — the "enabled-next" statement in the earlier paper's reconstruction and the point of use in the later one. It is the written support for the reagent-chain figure in Evidence 1: each arrow in that figure corresponds to one entry below.
The reagent chain — what each paper handed to the next
Read as concepts, the nine papers form a chain of ideas. Read at the level of Methods, they form a chain of physical objects: each paper's starting material is a reagent, cell line, or validated method produced by an earlier paper. This document traces that chain transition by transition.
H1 → H2
- What was handed forward: the full-length rabbit REPR (APOBEC-1) cDNA clone (pREPR/pcMVREPR, GenBank U10695) and its expression constructs, together with the finding that editing activity does not occur with REPR alone but only in the presence of auxiliary factor(s).
- Why the next step could not have happened without it: without the REPR cDNA clone, the liver-targeted transgenic construct (pLivREPR) could not have been built at all.
- Provenance: on the from side, the enabled-next statement reads "Provided the full-length rabbit REPR cDNA clone...expression constructs." On the to side, "Generation and expression of APOBEC-1 transgenics" builds the high-expression lines from this construct.
H2 → H3
- What was handed forward: the finding that in APOBEC-1-overexpressing liver, cytidines other than the canonical C6666 of apoB mRNA are also edited (the discovery of aberrant editing of TEC mRNA), the mooring-sequence-based bioinformatic method, and the pLivREPR transgenic animal lines.
- Why the next step could not have happened without it: the discovery of aberrant TEC editing in the 1995 paper supplied both the motivation and the animal material for systematically examining "hyperediting" — the editing of non-canonical sites within apoB mRNA itself.
- Provenance: on the from side, the enabled-next statement reads "identified a non-apo-B mRNA target (TEC tyrosine kinase) for aberrant C->U editing...provided the pLivREPR/pLiv11 hepatic expression vector and transgenic mouse/rabbit lines." On the to side, the objective is "determine whether cytidines other than the canonical C6666...are edited when APOBEC-1 is overexpressed in transgenic animal livers," and the paper sequences apoB mRNA from exactly these APOBEC-1 transgenic animal livers.
H3 → H4
- What was handed forward: the finding of mooring-sequence-independent hyperediting, the in-vitro hyperediting assay system (synthetic apoB RNA substrate + liver extract / recombinant MBP-APOBEC-1 + auxiliary-protein source), and the implication that an unidentified auxiliary protein exists.
- Why the next step could not have happened without it: without the hyperediting phenomenon and its assay system established, neither the application of the modified differential display to search for aberrant editing in a non-apoB mRNA (NAT1) nor the in-vitro confirmation of that editing could have been carried out.
- Provenance: on the from side, the enabled-next statement reads "establishes an in vitro hyperediting assay system...providing a basis and reagents/constructs...for future work to identify the unidentified auxiliary protein(s)." On the to side, the experiment "In vitro editing requires auxiliary proteins" states "Hyperediting of NAT1 occurred only in the presence of auxiliary proteins, not with recombinant APOBEC-1 alone," directly using the 1996 assay system and finding.
H4 → H5
- What was handed forward: the full-length NAT1 (p97/DAP5) cDNA clones (human, mouse, rabbit; GenBank U76111–U76113), the anti-NAT1 antibody, the mapped translation initiation codon, the bicistronic CAT-IRES-luciferase reporter system, and the finding that NAT1 suppresses cell proliferation as a translational repressor.
- Why the next step could not have happened without it: without the NAT1 cDNA clone and the bicistronic reporter system, neither the NAT1 gene targeting (knockout) in ES cells nor the functional analysis by IRES translation assay could have been performed.
- Provenance: on the from side, the enabled-next statement reads "produced full-length cloned NAT1 cDNAs...an anti-NAT1 polyclonal antibody...a bicistronic CAT-IRES-luciferase reporter system...enable later projects to test NAT1's role in cell growth/oncogenesis regulation." On the to side, the objective is "determine the in vivo function of NAT1/p97/DAP5 (an eIF4G homolog previously implicated in vitro as a global translation repressor)," and the experiment "Total protein synthesis and IRES translation assays" uses the bicistronic reporter.
H5 → H6
- What was handed forward: gene targeting (knockout construction in ES cells) with PCR/Southern genotyping, and the technical framework and strategy for analysing the control of ES-cell differentiation (targeting-vector design, use of selection markers, phenotypic analysis in embryonic stem cells).
- Why the next step could not have happened without it: the targeting and selection-marker technology established in building the NAT1 knockout ES cells and mice became the foundation for applying the same research strategy — identify ES-specific genes by digital differential display, then analyse function by gene targeting — to Fbx15.
- Provenance: on the from side, the enabled-next statement reads "produced NAT1+/- and NAT1-/- ES cell lines and a NAT1 knockout mouse model, plus validated tools (targeting vector pRTV-NAT1, PCR/Southern genotyping primers...)." On the to side, the experiment "Targeted disruption of Fbx15 in ES cells and mice" uses the same methods — similar targeting, Southern/PCR genotyping, and confirmation of germline transmission by blastocyst injection.
H6 → H9
- What was handed forward: the Fbx15-βgeo knock-in ES cell line (a reporter integrated at the Fbx15 locus as a G418-resistance selection marker), and the finding that Fbx15, although a direct Oct3/4–Sox2 target, is not essential for development or self-renewal.
- Why the next step could not have happened without it: precisely because Fbx15 is expressed ES-cell-specifically and is dispensable (loss of function leaves the animal normal), the selection marker (G418 resistance) knocked into its locus could be used as a harmless artificial reporter for detecting that a somatic cell had acquired pluripotency — which is what made it viable as the screening system for the 24-factor transduction experiment.
- Provenance: on the from side, the enabled-next statement reads "because Fbx15 proved dispensable but retains an Oct3/4/Sox2-responsive regulatory element, its enhancer/promoter and knock-in selectable marker system were later exploited...as a marker to select for induced pluripotency in reprogramming screens." On the to side, the experiment "24-factor screen with Fbx15 G418 selection assay" states "transduction of all 24 factors together generated 22 G418-resistant colonies," using G418 resistance at the Fbx15-βgeo locus as the selection criterion (the 2006 SI likewise states "MEF cells carrying a targeted Fbx15 locus selected for G418 resistance (Fbx15-βgeo knock-in)").
H7 → H9
- What was handed forward: the finding that ERas is expressed ES-cell-specifically and promotes ES-cell growth and tumorigenicity through the PI(3)K–Akt pathway, and the ERas cDNA / expression constructs.
- Why the next step could not have happened without it: the identification of ERas as an ES-cell-specific gene, with functional importance shown (growth promotion via the PI3K pathway), was the basis for including ERas in the 24-factor candidate list.
- Provenance: on the from side, the enabled-next statement reads "Identification of ERas as an ES-cell-specific constitutively active Ras-like gene...provides a defined molecular target/pathway...and reagents (ERas cDNA, knockout ES cell lines, antibodies, expression constructs) for future work." On the to side, the 2006 SI candidate-gene list includes ERas, which becomes one of the factors in the leave-one-out analysis ("24 factors − ERas," etc.).
H8 → H9
- What was handed forward: the method of identifying ES-cell-specific genes by digital differential display (the candidate-gene set including ecat1–9), the Nanog cDNA clone and the finding that Nanog overexpression maintains LIF-independent self-renewal, and the Nanog knockout ES cell line.
- Why the next step could not have happened without it: the screening method established in the Nanog work — identifying ES-specific candidate genes by digital differential display — and the ecat gene set obtained in that process (Ecat1, Dppa5/Esg1, Fbxo15, Nanog, Dppa4, Dppa3/Stella, etc.) formed the core of the 2006 24-factor candidate list.
- Provenance: on the from side, the enabled-next statement reads "Identification and cloning of the mouse nanog gene/cDNA...providing tools and rationale for downstream studies of pluripotency regulatory networks (e.g...later use of Nanog as a reprogramming factor)," and the experiment "Digital differential display and Northern blot screening for ecat genes" names "nine uncharacterized genes designated ecat1-9 (including ecat4/nanog)." On the to side, the 2006 SI candidate genes include Ecat1, Dppa5 (Esg1), Nanog, Dppa4, Dppa3 (Stella), and Ecat8 — the candidate set derived from the ecat1–9 screen of the 2003 Nanog paper.
The confluence of the 24-factor design
The 24 factors of the 2006 Cell paper did not come from a single origin; they were assembled from several converging lines of prior work.
First, the lineage running from the 1994 J Biol Chem paper through the 1997 Genes Dev paper to the 2000 EMBO J paper — which, as a derivative of the APOBEC-1 (REPR) RNA-editing research, discovered NAT1/DAP5 and established its gene-targeting and ES-cell knockout technology — supplied the "pipeline for analysing gene function in ES cells" (digital differential display → targeting vector → knockout ES cells and mice).
Second, the three 2003 papers (Fbx15, ERas, Nanog) used this technical base. All three identified ES-cell-specific genes (the ecat set, plus Fbx15, ERas, and Nanog) by the same digital differential display method. Fbx15 was shown to be a direct Oct3/4–Sox2 target yet dispensable for development, and the G418-resistant βgeo selection-marker knock-in at its locus was transferred directly into the 2006 somatic-reprogramming screen as its selection system (scored by G418-resistant colony formation). ERas, shown to be functionally important as a promoter of ES-cell growth and tumorigenicity via the PI3K pathway, was added as a candidate. The ecat gene set identified in the Nanog paper (Ecat1, Dppa5/Esg1, Dppa4, Dppa3/Stella, Ecat8, etc.) and Nanog itself were a major source of the 24 candidates.
These independently identified ES-cell-specific genes — together with knowledge from outside the lineage (Oct3/4, Sox2, Klf4, c-Myc) — were pooled in the Fbx15-βgeo selection system and narrowed by leave-one-out (removing one factor at a time), arriving finally at the four factors (Oct3/4, Sox2, Klf4, c-Myc).
Machine Traces of Discovery Paths #2 — Evidence 3 of 4 · The 24 → 10 → 4 selection
Verifiable source document for the Deep Dive essay Machine Traces of Discovery Paths #2 — The Path to iPS Discovery, A Comprehensive Analysis and Reconstruction. This document reconstructs the factor-selection process of the 2006 paper from its body Results (Figure 2) and its Supplemental Data: the 24 candidates in the order the SI lists them, the multi-stage narrowing with the colony counts printed at each stage, the Fbx15-βgeo reporter system as far as the SI describes it, and the protocol values and gaps found in the Supplemental Data. This is where the essay's claim — that the four factors were reached in two rounds of removal, not one — is supported line by line.
The selection process of the 2006 paper — from the SI and the body Methods
The 24 candidate factors (in SI order)
- Ecat1
- Dppa5 (Esg1)
- Fbxo15
- Nanog
- ERas
- Dnmt3l
- Ecat8
- Gdf3
- Sox15
- Dppa4
- Dppa2
- Fthl17
- Sall4
- Oct3/4 (Pou5f1)
- Sox2
- Rex1 (Zfp42)
- Utf1
- Tcl1
- Dppa3 (Stella)
- Klf4
- β-catenin
- c-Myc
- Stat3
- Grb2
The 24 → 10 → 4 narrowing (body Results, Figure 2)
Stage 1: transduction of all 24 factors together. Introducing all 24 factors simultaneously into Fbx15^βgeo/βgeo MEFs produced 22 G418-resistant colonies. Of these, 12 clones were kept in culture under selection, and 5 clones showed ES-cell-like morphology. Mock gave 0 colonies.
Stage 2: removal of one factor at a time from the 24 (leave-one-out). Pools with a single factor withdrawn were transduced, and G418-resistant colony numbers were counted. For ten factors (numbers 3, 4, 5, 11, 14, 15, 18, 20, 21, 22), removal abolished colony formation by 10 days after transduction. The combination of these ten factors alone produced more ES-cell-like colonies than all 24 together.
Stage 3: removal of one factor at a time from the 10. Here the four factors separated out.
| Factor removed | Number | Result |
|---|---|---|
| Oct3/4 | 14 | no G418-resistant colonies form |
| Klf4 | 20 | no G418-resistant colonies form |
| Sox2 | 15 | only a very few colonies |
| c-Myc | 22 | colonies form but are flat and non-ES-cell-like |
| remaining 6 factors | — | no significant effect on colony number |
Stage 4: verification of combinations. The four factors (Oct3/4, Sox2, c-Myc, Klf4) produced colony numbers comparable to the ten. Culturing 12 clones each established 4 iPS-MEF4 clones and 5 iPS-MEF10 clones. No two-factor combination produced any colonies. For three-factor combinations:
- Oct3/4 + Sox2 + c-Myc (no Klf4) → 1 small colony, could not be maintained
- Klf4 + Sox2 + c-Myc (no Oct3/4) → 1 small colony, could not be maintained
- Oct3/4 + Klf4 + Sox2 (no c-Myc) → 36 colonies, but flat and non-ES-cell-like
- Oct3/4 + Klf4 + c-Myc (no Sox2) → 54 colonies, 6 picked; passageable, but iPS-MEF3 morphology differs from iPS-MEF4/10 with a rougher surface
What this final stage shows is that the three factors Oct3/4 + c-Myc + Klf4 can activate the Fbx15 locus even without Sox2, but that what is happening there is different from the four-factor case. In other words, the Fbx15 reporter measures not "acquisition of pluripotency" but "activation of the Fbx15 locus," and this divergence made the 2007 move to the Nanog selection system a necessity rather than merely an improvement.
The Fbx15-βgeo reporter system (as far as the SI describes it)
The Fbx15 selection system is referenced via 'Methylation analysis of Fbx15' and 'RT-PCR for Neo' primers in Table S9, and the transfection table (Table S2) lists MEF cells carrying a targeted Fbx15 locus selected for G418 resistance (Fbx15-βgeo knock-in), used as the reporter cell line (MEF, Fbx15-βgeo) in which G418-resistant colonies were scored after retroviral transduction of candidate factor combinations. (The supplemental text does not provide additional construction details such as the targeting vector map, homology arms, or cell line derivation beyond referencing the Neo/βgeo selection cassette primers (Neo-S63/Neo-AS581) and G418-resistant colony counts in Table S2.)
[P] values obtained from the SI
- [P] Cell plating densities: MEF 1 x 10^5 cells (7/19/2005, 8/15/2005, 8/29/2005 experiments); MEF 8 x 10^5 cells (9/12/2005, 9/26/2005, 11/20/2005 experiments); TTF 8 x 10^5 cells (11/14/2005); MSC 8 x 10^5 cells (11/14/2005); TTFgfp 8 x 10^5 cells (12/29/2005, 4/11/2006); MSCgfp 8 x 10^5 cells (12/29/2005)
- [P] Clonal density for colony analysis: 2000 cells per 100-mm dish (Figure S10)
- [P] Retrovirus production/transfection system: PLAT-E packaging cells with pMX retroviral vector system (Figure S11); pMX-IP and pMX-ECAT1-IP plasmids used (Figure S12)
- [P] Transfection ratios of GFP-expressing retroviral vector to control vector: 1:0, 1:3, 1:9, 1:23 (Figure S11)
- [P] Transfection efficiency: 88%, 83%, 81%, 73% of cells GFP+ at ratios 1:0,1:3,1:9,1:23 respectively (Figure S11)
- [P] Calculated fraction of cells expressing all factors: ~47% (0.83^4) for 4 factors, ~12% (0.81^10) for 10 factors, ~0.05% (0.73^24) for 24 factors (Figure S11)
- [P] Plating for retroviral infection: 8 x 10^5 cells per 100-mm dish, of which ~4 x 10^5 cells estimated to express all 4 selected factors (Figure S11)
- [P] Colony yield: ~100 iPS colonies obtained after G418 selection following introduction of 4 factors (~0.02% of transfected cells) (Figure S11)
- [P] Puromycin selection: 2 µg/ml puromycin for 2 days to eliminate non-infected cells, applied 48 hours after infection with pMX-IP/pMX-ECAT1-IP (Figure S12)
- [P] Telomerase assay: TRAPEZE telomerase detection kit (Chemicon); negative control lysates heated at 85°C for 10 minutes; products run on non-denaturing TBE-based 12% polyacrylamide gel, visualized with ethidium bromide (Figure S2)
- [P] Teratoma histology: paraffin-embedded sections stained with hematoxylin and eosin, photographed at x10 objective (Figure S3)
- [P] In vitro differentiation protocol: iPS cells plated on bacterial culture dishes, incubated 3 days in medium without LIF; aggregates then transferred to gelatin-coated tissue culture dishes and incubated another 3 days; fixed and stained with anti-βIII tubulin, anti-α-fetoprotein, anti-α-smooth muscle actin, Cy3-conjugated secondary antibody, DAPI nuclear stain (Figure S7)
- [P] Alkaline phosphatase staining performed 7 days after clonal plating (Figure S10)
- [P] Table S1 cloning primers listed for all 24 candidate factors (Ecat1, Dppa5/Esg1, Fbxo15, Nanog, ERas, Dnmt3l, Ecat8, Gdf3, Sox15, Dppa4, Dppa2, Fthl17, Sall4, Oct3/4, Sox2, Rex1, Utf1, Tcl1, Dppa3, Klf4, β-catenin, c-Myc, Stat3, Grb2) with forward/reverse primer sequences and GenBank accession numbers
- [P] Table S9 lists numerous named primer pairs (e.g., MeOct3/4-DMR-S/AS, MeNanog-F2-S/AS, Fbxpro-scU488/L712 and nested Fbxpro-scU524/L692 for Fbx15 methylation, Ecat1-RT-S/AS, pH34-U38/L394 for Esg1, 6047-S1/AS1 for endogenous Nanog, Neo-S63/AS581 for Neo, Oct3/4-ChIP-S1/AS1, Nanog-exon-ChIP-S/AS, and many RT-PCR primer pairs for Rex1, Utf1, Klf4, c-Myc, Sox2, Gata6, Brachyury (T), Map2, Cdx2, Cripto, Dax1, Zfp296, Nat1)
Items not stated in the SI
- [S] No detailed Fbx15-βgeo targeting vector map, homology arm sequences, or targeting construct design (only inferred from Neo primer and methylation primers)
- [S] No explicit statement of which ES/MEF cell line background carries the Fbx15-βgeo knock-in, nor its full derivation/genotyping confirmation protocol
- [S] No explicit retrovirus titering method or MOI value stated numerically (only transfection ratios and inferred percentages)
- [S] No explicit G418 concentration (dose in µg/ml) given anywhere in this supplemental text
- [S] No composition of ES/iPS culture medium (e.g., serum percentage, LIF concentration, base medium name) stated for routine maintenance, only 'medium without LIF' mentioned for differentiation assay
- [S] No explicit duration (days) from infection to G418 selection start, or total selection duration, given as a fixed protocol value
- [S] No sequences or map for pMX vector itself, or pMX-ECAT1-IP construct beyond the name
- [S] No explicit statement of PLAT-E cell transfection reagent, DNA amounts, or incubation temperature/CO2 conditions
- [S] No given citation/method reference for how PLAT-E cells were originally generated
- [S] No full statement of how mouse strains (129, C57/BL6, ICR) relate to the actual gDNA source cell lines beyond SSLP allele tables
- [S] No explicit total RNA input amounts or RT-PCR cycling conditions (annealing temp, cycle number) for any primer pair listed
Machine Traces of Discovery Paths #2 — Evidence 4 of 4 · Resolution: abstract versus full text
Verifiable source document for the Deep Dive essay Machine Traces of Discovery Paths #2 — The Path to iPS Discovery, A Comprehensive Analysis and Reconstruction. This document compares the two reconstructions of the same discovery — the abstract-and-reference-level trace of #1 and the full-text trace of #2 — and records the five things that became visible only on reading the full text. Two of the five revise the account given in #1; the others were noted in #1 and are confirmed here at Methods level.
Resolution — the abstract-and-reference version and the full-text version
The earlier whole-corpus reconstruction (a corpus of 1,038 items reduced to 275 after disambiguation, using abstracts and reference lists only) identified four hinge points. This reconstruction reads the full text of the nine skeleton papers. The differences are as follows.
| Item | Old (abstract + references) | New (full text) |
|---|---|---|
| Source text used as basis | 0 papers (abstracts and reference lists only) | 9 papers (full Methods/Results + 41-page SI) |
| Hinge points | 4 | 9 |
| Experiments described | 0 | 70 |
| Verbatim-quote support | 0 | 70 (all confirmed against source) |
| [P] extracted parameters | 0 | 444 |
| [S] gaps made explicit | 0 | 104 |
| The 24 factors | "24 candidates" (count only) | all 24 gene names (in SI order) |
| Granularity of selection | "narrowed to 4 by leave-one-out" | 24 → 10 → 4 in three stages, with the colony counts and factor numbers at each stage |
What became visible only on reading the full text
1. The four factors did not come from a single leave-one-out. The old version stated that the 24 candidates were narrowed to four "by leave-one-out." What the full text shows is two rounds of removal. The first round (from 24) narrowed the set to ten; the second round (from ten) separated out the four. Moreover, the ten-factor combination alone produced more ES-like colonies than all 24 together — the 24-factor set contained factors that acted inhibitorily. This "ten-factor stage" does not appear in the abstract.
2. What the Fbx15 reporter was measuring is not pluripotency. The three factors Oct3/4 + Klf4 + c-Myc (without Sox2) formed 54 colonies, six of which were passageable. In other words, the Fbx15 locus can be activated without all four factors. The old version could say only that "Fbx15 was dispensable, so it could be used as a selection marker." What the full text shows is that this selection system is a proxy that measures activation of the Fbx15 locus rather than pluripotency itself, and that this divergence is the causal reason the move to the Nanog selection system in 2007 was a necessity.
3. The experiment at each stage builds the "reagent" for the next stage. The old version described the path as a chain of concepts. At the full-text level it connects as physical objects — the 1994 pcMVREPR builds the 1995 overexpression mice; the 1997 NAT1 cDNA and antibody make the 2000 knockout analysis possible; and the Fbx15-βgeo knock-in ES/MEF line built in the 2003 Fbx15 paper becomes the screening system of 2006 itself.
4. "Cannot differentiate" was not a hypothesis but a by-product (noted in the old version, confirmed here). The design purpose of the 2000 paper was the in-vivo verification of NAT1's translational-repression function, and that prediction (global translational repression) was wrong: total translation in NAT1-null ES cells was normal. The failure to differentiate is an unexpected phenotype observed in the routine course of making the knockout.
5. There are 104 places where the information needed to reproduce the work is missing. In the old version, "reproducibility" was not even a subject of discussion. Full-text extraction establishes that 104 items — medium composition, seeding density, scoring criteria, statistical handling, and so on — are not printed in the papers. In all nine papers, the full composition of the ES-cell culture medium is stated not once (even the Nanog paper, which has the most detailed Methods, records only "ES cell medium"). To present the path at an executable granularity, these must be made explicit as [S] (to be supplied from period-standard values).
References
Cited in author–year form; listed alphabetically by first author, then year. Bibliographic fields retrieved from PubMed E-utilities and reconciled against the source papers.
(Boiko, D. A. et al., 2023) Boiko DA, MacKnight R, Kline B, Gomes G. Autonomous chemical research with large language models. Nature. 2023;624(7992):570-578. doi:10.1038/s41586-023-06792-0. PMID: 38123806.
(Kanda, G. N. et al., 2022) Kanda GN, Tsuzuki T, Terada M, Sakai N, Motozawa N, Masuda T, et al. Robotic search for optimal cell culture in regenerative medicine. eLife. 2022;11:e77007. doi:10.7554/eLife.77007. PMID: 35762203.
(Mitsui, K. et al., 2003) Mitsui K, Tokuzawa Y, Itoh H, Segawa K, Murakami M, Takahashi K, et al. The homeoprotein Nanog is required for maintenance of pluripotency in mouse epiblast and ES cells. Cell. 2003;113(5):631-42. doi:10.1016/s0092-8674(03)00393-3. PMID: 12787504.
(Takahashi, K. et al., 2003) Takahashi K, Mitsui K, Yamanaka S. Role of ERas in promoting tumour-like properties in mouse embryonic stem cells. Nature. 2003;423(6939):541-5. doi:10.1038/nature01646. PMID: 12774123.
(Takahashi, K. & Yamanaka, S., 2006) Takahashi K, Yamanaka S. Induction of pluripotent stem cells from mouse embryonic and adult fibroblast cultures by defined factors. Cell. 2006;126(4):663-76. doi:10.1016/j.cell.2006.07.024. PMID: 16904174.
(Tokuzawa, Y. et al., 2003) Tokuzawa Y, Kaiho E, Maruyama M, Takahashi K, Mitsui K, Maeda M, et al. Fbx15 is a novel target of Oct3/4 but is dispensable for embryonic stem cell self-renewal and mouse development. Mol Cell Biol. 2003;23(8):2699-708. doi:10.1128/MCB.23.8.2699-2708.2003. PMID: 12665572.
(Yamanaka, S. et al., 1994) Yamanaka S, Poksay KS, Balestra ME, Zeng GQ, Innerarity TL. Cloning and mutagenesis of the rabbit ApoB mRNA editing protein. A zinc motif is essential for catalytic activity, and noncatalytic auxiliary factor(s) of the editing complex are widely distributed. J Biol Chem. 1994;269(34):21725-34. doi:10.1016/s0021-9258(17)31865-3. PMID: 8063816.
(Yamanaka, S. et al., 1995) Yamanaka S, Balestra ME, Ferrell LD, Fan J, Arnold KS, Taylor S, et al. Apolipoprotein B mRNA-editing protein induces hepatocellular carcinoma and dysplasia in transgenic animals. Proc Natl Acad Sci U S A. 1995;92(18):8483-7. doi:10.1073/pnas.92.18.8483. PMID: 7667315.
(Yamanaka, S. et al., 1996) Yamanaka S, Poksay KS, Driscoll DM, Innerarity TL. Hyperediting of multiple cytidines of apolipoprotein B mRNA by APOBEC-1 requires auxiliary protein(s) but not a mooring sequence motif. J Biol Chem. 1996;271(19):11506-10. doi:10.1074/jbc.271.19.11506. PMID: 8626710.
(Yamanaka, S. et al., 1997) Yamanaka S, Poksay KS, Arnold KS, Innerarity TL. A novel translational repressor mRNA is edited extensively in livers containing tumors caused by the transgene expression of the apoB mRNA-editing enzyme. Genes Dev. 1997;11(3):321-33. doi:10.1101/gad.11.3.321. PMID: 9030685.
(Yamanaka, S. et al., 2000) Yamanaka S, Zhang XY, Maeda M, Miura K, Wang S, Farese RV Jr, et al. Essential role of NAT1/p97/DAP5 in embryonic differentiation and the retinoic acid pathway. EMBO J. 2000;19(20):5533-41. doi:10.1093/emboj/19.20.5533. PMID: 11032820.
How to cite
Kitano, H. (2026). Lab Notebook for
Machine Traces of Discovery Paths #2 - The Path to iPS Discovery, A Comprehensive Analysis and Reconstruction, The Discovery Engine .
ORCID: 0000-0002-3589-1953
https://orcid.org/0000-0002-3589-1953
First published: August 14, 2026